How is Korea’s Blood Supply Maintained? - Effects of the COVID-19 Pandemic, Blood Shortage Periods, and Promotions on Blood Supply Dynamics
Published
Donggyu Kim*
* Swiss Institute of Artificial Intelligence, Chaltenbodenstrasse 26, 8834 Schindellegi, Schwyz, Switzerland
This study quantitatively assesses the effects of the COVID-19 pandemic, blood shortage periods, and promotional activities on blood supply and usage in Korea. Multiple linear regression analysis was conducted using daily blood supply, usage, and stock data from 2018 to 2023, incorporating various control variables. Findings revealed that blood supply decreased by 5.11% and blood usage decreased by 4.25% during the pandemic. During blood shortage periods, blood supply increased by 3.96%, while blood usage decreased by 1.98%. Although the signs of the estimated coefficients aligned with those of a previous study [1], their magnitudes differed. Promotional activities had positive effects on blood donation across all groups, but the magnitude of the impact varied by region and gender. Special promotions offering sports viewing tickets were particularly effective. This study illustrates the necessity of controlling exogenous variables to accurately measure their effects on blood supply and usage, which are influenced by various social factors. The findings underscore the importance of systematic promotion planning and suggest the need for tailored strategies across different regions and demographic groups to maintain a stable blood supply.
1. Introduction
Blood transfusion is an essential treatment method used in emergencies, for certain diseases, and during surgeries. Blood required for transfusion cannot be substituted with other substances and has a short shelf life. Additionally, it experiences demand surges that are difficult to predict. Therefore, systematic management of blood stock is required. Blood stock is determined by blood usage and the number of blood donors. Thus, understanding the relationship between usage and supply, as well as the effect of promotions, is essential for effective blood stock management.
There is a paucity of quantitative research on blood supply dynamics during crises and the effects of promotional activities. This study aims to address this research gap. Previous studies in Korea on blood donation have primarily focused on qualitative analysis to identify motives for blood donation through surveys.[2][3][4][5] Kim (2015)[6] used multiple linear regression analysis to predict the number of donations for individual donors but used the personal information of each donor as explanatory variables and did not consider time series characteristics. For this reason, understanding the dynamics of the total number of donors was difficult. Kim (2023)[1] studied the impact of the COVID-19 epidemic on the number of blood donations but did not control exogenous variables and types of blood donation.
This study aims to quantify the effects of the COVID-19 pandemic and blood shortage periods on blood supply and usage. Additionally, it measures the quantitative effects of various promotions on the number of blood donors. To achieve these objectives, regression analysis was utilized with control variables, enabling more precise estimations than previous studies. Based on these findings, this paper proposes effective blood management methods.
2. Methodology
2.1. Research Subjects
According to the Blood Management Act[7], blood can be collected at medical institutions, the Korean Red Cross Blood Services, and the Hanmaeum Blood Center. According to the Annual Statistical Report[8], blood donations conducted by the Korean Red Cross accounted for 92% of all blood donations in 2022. This study uses blood donation data from the Korean Red Cross Blood Services, which accounts for the majority of the blood supply.
2.2. Data Sources
The data for the number of blood donors by location utilized in this study were obtained from the Annual Statistical Report on Blood Services.[8] The daily data on the number of blood donors, blood usage, blood stock, and promotion dates were provided by the Korean Red Cross Blood Services[9].
The data for the number of blood donors, blood usage, and blood stock used in the study cover the period from January 1, 2018, to July 31, 2023, and the promotion date data cover the period from January 1, 2021, to July 31, 2023. Temperature and precipitation data were obtained from the Korea Meteorological Administration’s Automated Synoptic Observing System (ASOS) [10].
2.3. Variable Definitions
In this study, the number of blood donors, or blood supply, is defined as the number of whole blood donations at the Korean Red Cross. The COVID-19 pandemic period is defined as the duration from January 20, 2020, (the first case in Korea) to March 1, 2022 (the end of the vaccine pass operation). Red blood cell product stock is defined as the sum of concentrated red blood cells, washed red blood cells, leukocyte-reduced red blood cells, and leukocyte-filtered red blood cell stock.
Blood usage is based on the quantity of red blood cell products supplied by the Korean Red Cross to medical institutions. The regions in the study are divided according to the jurisdictions of the blood centers under the Korean Red Cross Blood Service and do not necessarily coincide with Korea’s administrative districts. Data from the Seoul Central, Seoul Southern, and Seoul Eastern Blood Centers were integrated and used as Seoul.
Weather information for each region is based on measurements from the nearest weather observation station to the blood center, and the corresponding Observation point numbers for each region are listed in Table 1.
Public holidays are based on the Special Day Information[11] from the Korea Astronomy and Space Science Institute.
\begin{array}{l|r}
\hline
\textbf{Blood center name} & \textbf{Observation station number} \\
\hline
\text{Seoul} & 108 \\
\text{Busan} & 159 \\
\text{Daegu/Gyeongbuk} & 143 \\
\text{Incheon} & 112 \\
\text{Ulsan} & 152 \\
\text{Gyeonggi} & 119 \\
\text{Gangwon} & 101 \\
\text{Chungbuk} & 131 \\
\text{Daejeon/Sejong/Chungnam} & 133 \\
\text{Jeonbuk} & 146 \\
\text{Gwangju/Jeonnam} & 156 \\
\text{Gyeongnam} & 255 \\
\text{Jeju} & 184 \\
\hline
\end{array}
Table 1. Observation Station number for each Blood Center
2.4. Variable Composition
Dependent Variable Plasma donations, 67% of which are used for pharmaceutical raw materials[8], can be imported due to their long shelf life of 1 year.[7] Also, in the case of platelet and multi-component blood donation, 95% of donors are male[8], and a decent number of days have no female blood donors, affecting the analysis. For these reasons, this study used the number of whole-blood donors as the target variable. Additionally, the amount of collected blood is determined by an individual’s physical condition[7], not by preference. Therefore, it is integrated within gender groups.
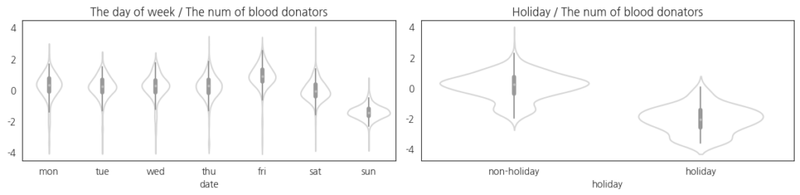
Explanatory Variables Considering the differences in operating hours of blood donation centers on weekdays, weekends, and holidays as shown in Figure 1, variables indicating the day of week and holiday were considered.
Table 2 shows that there are differences between regions on blood donation. Considering this, region was used as a control variable.
The annual seasonal effects are not controlled by the holidays variable alone. for this reason, Fourier terms were introduced as explanatory variables [12].
\begin{array}{l|r|r|r}
\hline
\textbf{Blood center name}& \textbf{Population} & \textbf{Blood donation} & \textbf{Blood donation ratio (%)} \\
\hline
\text{Total} & 51,439,038 & 2,649,007 & 5.1 \\
\hline
\text{Seoul} & 9,428,372 & 846,646 & 9.0 \\
\text{Busan} & 3,317,812 & 204,250 & 6.2 \\
\text{Daegu/Gyeongbuk} & 4,964,183 & 225,245 & 4.5 \\
\text{Incheon} & 2,967,314 & 170,777 & 5.8 \\
\text{Ulsan} & 13,589,432 & 217,008 & 1.6 \\
\text{Gyeonggi} & 1,536,498 & 124,866 & 8.1 \\
\text{Gangwon} & 1,595,058 & 83,820 & 5.3 \\
\text{Chungbuk} & 3,962,700 & 237,169 & 6.0 \\
\text{Daejeon/Sejong/Chungnam} & 1,769,607 & 96,992 & 5.5 \\
\text{Jeonbuk} & 3,248,747 & 189,559 & 5.8 \\
\text{Gwangju/Jeonnam} & 3,280,493 & 123,250 & 3.8 \\
\text{Gyeongnam} & 1,110,663 & 87,677 & 7.9 \\
\text{Jeju} & 678,159 & 41,748 & 6.2 \\
\hline
\end{array}
Table 2. Blood donation rate by region[8]
$$X_{sin_{ij}} = \sin \left( \frac{2\pi \operatorname{doy}(bd)_{i}}{365}j \right),\quad X_{cos_{ij}} = \cos\left( \frac{2\pi \operatorname{doy}(bd)_{i}}{365}j \right)$$
Where $\operatorname{doy}\text{(01-01-yyyy)} = 0,\dots, \operatorname{doy}\text{(12-31-yyyy)} = 364$
$j$ is a hyperparameter setting the number of Fourier terms added. $j = 1,\dots,6$ terms with optimal AIC[13] were added to the model.
According to Table 2, 70% of all blood donors visit blood donation centers to donate. Therefore, to control the influence of weather conditions[14] that affect the pedestrian volume and the number of blood donors, a precipitation variable was included. Meanwhile, the temperature variable, which has a strong relationship with the season, was already controlled by Fourier terms and was found to be insignificant, so it was excluded from the explanatory variables.
\begin{array}{l|r}
\hline
\textbf{Blood donation place} & \textbf{Ratio} \\
\hline
\text{Individual, blood donation center} & 74.8\% \\
\text{Individual, street} & 0.3\% \\
\text{Group} & 24.9\% \\
\hline
\end{array}
Table 3. Ratio of blood donation by place
The Public-Private Joint Blood Supply Crisis Response Manual[15] specifies blood usage control measures during crises (Table 4). To reflect the effect of crises in the model, a blood shortage day variable was created and introduced as a proxy for the crisis stage.
A blood shortage day is defined as a day when the daily blood stock is three times less than the average daily usage in the previous year, as well as the following 7 days. The mathematical expression is as follows:
\begin{array}{l|r}
\hline
\textbf{Category} & \textbf{Criteria} \\
\hline
\text{Interest} & (bs) < 5 \times (bu)_{prev\, year} \\
\text{Cautious} & (bs) < 3 \times (bu)_{prev\, year} \\
\text{Alert} & (bs) < 2 \times (bu)_{prev\, year} \\
\text{Serious} & (bs) < 1 \times (bu)_{prev\, year} \\
\hline
\end{array}
Table 4. Criteria for blood supply crisis stage[15]
Where $(bs)$ is the blood stock and $(bu)$ is the blood usage
$$(bu)_{prev\, year}[(bu)_{i}] := \frac{1}{365}\sum_{\{j|\operatorname{year}[(bu)_{j}]= \operatorname{year}[(bu)_{i}]-1\}}(bu)_{j}$$
$$C_{i} := \mathbf{1}\left[ (bs)_{i} < 3 \times (bu)_{prev\, year}[(bu)_{i}] \right]$$
$$D_{short, i}:= \operatorname{sgn}[\sum\limits_{j=i-6}^{i} C_{j}]$$
According to Figure 2, population movement decreased during the COVID-19 pandemic, and blood donation was not allowed for a certain period after COVID recovery or vaccination.[7] Bae (2021)[16] showed factors that affected the decrease in blood donors during this period. Kim (2023)[1] also showed that there was a decrease in blood donation during this period. To control the effect of the pandemic, COVID-19 pandemic period dummy variables were introduced.

2.5. Research Method
To analyze the effects of promotions according to region and gender, this study conducted multiple regression analyses. The OLS model was chosen because it clearly shows the linear relationship between variables, and the results are highly interpretable.
Control variables were used to derive accurate estimates. The model’s accuracy was confirmed through the estimated effect of the COVID-19 and blood shortage period variables, consistent with the prior studies.
\begin{array}{l|r}
\hline
\textbf{Variable Name} & \textbf{Description} \\
\hline
D_{dow_{ij}} = \mathbf{1}[\operatorname{dow}(bd_{i}) = j] & \text{Day of week dummies} \\
\text{where} \operatorname{dow}\text{(monday)}=0, \dots, \operatorname{dow}\text{(sunday)}=6 & \\
\hline
D_{hol} & \text{Holiday dummy} \\
\hline
D_{short} & \text{Shortage day dummy} \\
\hline
D_{cov\, week} & \text{COVID pandemic weekday dummy} \\
\hline
D_{cov\, sat} & \text{COVID pandemic Saturday dummy} \\
\hline
D_{cov\, sun} & \text{COVID pandemic Sunday dummy} \\
\hline
X_{sin_{ij}} = \sin\left(\frac{2\pi \operatorname{doy}(bd_{i})}{365}\right) \\
X_{cos_{ij}} = \cos\left(\frac{2\pi \operatorname{doy}(bd_{i})}{365}\right) & \text{Fourier terms for yearly seasonality} \\
\text{where} \operatorname{doy}\text{(01-01-yyyy)} = 0, \dots, \operatorname{doy}\text{(12-31-yyyy)} = 364 & \\
\hline
X_{rain\, fall, r} & \text{Precipitation in region r} \\
\hline
D_{promo} & \text{Promotion dummy} \\
\hline
D_{special\, promo} & \text{Special promotion dummy} \\
\hline
\end{array}
Table 5. Variable Description
The proposed model for the number of blood donors is expressed as an OLS model, as shown in Equation (1). The model for blood usage is also defined using the same explanatory variables.
\begin{equation}\begin{aligned}
bd_{i} &= \sum\limits_{j=0}^{6}\beta_{dow_{j}}D{dow_{ij}} + \beta_{h}D_{hol} + \beta_{s}D_{short}\\
&+ \beta_{cw}D_{cov\, week_{i}} + \beta_{c\, sat}D_{cov\, sat_{i}} + \beta_{c\, sun}D_{cov\, sun_{i}}\\
&+ \sum\limits_{j=1}^{7}(\beta_{cos_{j}}X_{cos_{ij}} + \beta_{sin_{j}}X_{sin_{ij}}) + D_{promo} + D_{special\, promo}
\end{aligned}\tag{1}\label{eq1}
\end{equation}
The model considering regional characteristics is shown in Equation \eqref{eqn:bd_region}, where $r$ represents each region.
\begin{equation}\begin{aligned}\label{eqn:bd_region}
bd_{i,r} &= \sum\limits_{j=0}^{6}\beta_{dow_{j, r}}D_{dow_{ij}} + \beta{h, r}D_{hol} + \beta_{s, r}D_{short}\\
&+ \beta_{cw, r}D_{cov\, week_{i}} + \beta{c\, sat, r}D_{cov\, sat_{i}} + \beta{c\, sun, r}D_{cov\, sun_{i}}\\
&+ \sum\limits_{j=1}^{7}(\beta_{\cos_{j}, r}X_{\cos_{ij}} + \beta_{\sin_{j}, r}X_{\sin_{ij}}) + X_{rain\, fall, r} + D_{promo} + D_{special\, promo}
\end{aligned}\tag{2}\label{eq2}
\end{equation}
3. Result and Discussion
The regression results presented in Tables 6 and 7 reveal patterns in blood supply and usage dynamics. The day of the week significantly influences both supply and demand, also holidays have a substantial negative impact. The high R-squared value (0.902) of the blood usage model suggests that it accounts for most of the variability in blood usage.
\begin{array}{lcccc}
\hline
& & \textbf{Blood Supply Model Summary} & & \\
\hline
\text{R-squared} & 0.657 & \text{Adj. R-squared} & 0.653 \\
\hline
& coef & std err & t-value & \texttt{P>|t|} \\
mon & 5818.4625 & 52.319 & 111.211 & 0.000 \\
tue & 5660.4049 & 52.225 & 108.385 & 0.000 \\
wed & 5776.1600 & 52.270 & 110.507 & 0.000 \\
thu & 5704.9131 & 52.033 & 109.641 & 0.000 \\
fri & 6587.9064 & 52.282 & 126.008 & 0.000 \\
sat & 5072.4046 & 62.301 & 81.417 & 0.000 \\
sun & 3211.1523 & 62.386 & 51.472 & 0.000 \\
holiday & -3116.7659 & 92.486 & -33.700 & 0.000 \\
shortage & 214.1011 & 85.250 & 2.511 & 0.012 \\
cov\_weekday& -482.9943 & 45.439 & -10.629 & 0.000 \\
cov\_sat & 280.2871 & 101.498 & 2.762 & 0.006 \\
cov\_sun & 128.8915 & 100.873 & 1.278 & 0.201 \\
sin\_1 & -2.1102 & 26.913 & -0.078 & 0.938 \\
cos\_1 & 34.2147 & 26.223 & 1.305 & 0.192 \\
sin_2 & -175.5033 & 26.685 & -6.577 & 0.000 \\
cos\_2 & 0.0618 & 26.736 & 0.002 & 0.998 \\
sin\_3 & 94.0805 & 26.947 & 3.491 & 0.000 \\
cos\_3 & 59.8794 & 26.371 & 2.271 & 0.023 \\
sin\_4 & -37.4031 & 26.410 & -1.416 & 0.157 \\
cos\_4 & -158.1612 & 26.401 & -5.991 & 0.000 \\
sin\_5 & -84.8483 & 26.622 & -3.187 & 0.001 \\
cos\_5 & -2.8368 & 26.699 & -0.106 & 0.915 \\
sin\_6 & 102.8305 & 26.498 & 3.881 & 0.000 \\
cos\_6 & -53.5580 & 26.240 & -2.041 & 0.041 \\
sin\_7 & -90.8545 & 26.299 & -3.455 & 0.001 \\
cos\_7 & 3.4063 & 26.318 & 0.129 & 0.897 \\
\hline
\end{array}
Table 6. Summary of blood supply model
While the relatively lower R-squared value (0.657) of the blood supply model indicates that it is influenced by various random social effects.
3.1. Impact of the COVID-19 Pandemic
Table 7 shows that blood usage decreased by 4.25% during the COVID-19 pandemic period. This includes not only the man-made decrease in the supply due to the blood shortage but also the impact on the demand, where surgeries were reduced due to COVID- 19. Table 6 shows that blood supply also decreased by 5.11% during the same period.
3.2. Impact of Blood Shortage Periods
During blood shortage periods, blood usage decreased by 1.98% (Table 7), while blood supply increased by 3.96% (Table 6) due to conservation efforts and increased donations. This result reflects the efforts made by medical institutions to adjust blood usage and the impact of blood donation promotion campaigns in response to blood shortage situations.
\begin{array}{lcccc}
\hline
& & \textbf{Blood Usage Model Summary} & & \\
\hline
\text{R-squared} & 0.902 & \text{Adj. R-squared} & 0.901 \\
\hline
& coef & std err & t-value & \texttt{P>|t|} \\
mon & 6580.0769 & 33.335 & 197.390 & 0.000 \\
tue & 6326.6840 & 33.276 & 190.130 & 0.000 \\
wed & 6020.3690 & 33.304 & 180.771 & 0.000 \\
thu & 6017.6003 & 33.153 & 181.509 & 0.000 \\
fri & 6064.1381 & 33.312 & 182.043 & 0.000 \\
sat & 3293.3294 & 39.696 & 82.964 & 0.000 \\
sun & 2329.8185 & 39.750 & 58.612 & 0.000 \\
holiday & -2594.7261 & 58.928 & -44.032 & 0.000 \\
shortage & -103.5165 & 54.318 & -1.906 & 0.057 \\
cov\_weekday& -316.7550 & 28.952 & -10.941 & 0.000 \\
cov\_sat & -2.1619 & 64.670 & -0.033 & 0.973 \\
cov\_sun & 29.0202 & 64.272 & 0.452 & 0.652 \\
sin\_1 & -53.2172 & 17.148 & -3.103 & 0.002 \\
cos\_1 & 59.3688 & 16.708 & 3.553 & 0.000 \\
sin\_2 & -86.3912 & 17.003 & -5.081 & 0.000 \\
cos\_2 & 20.3897 & 17.035 & 1.197 & 0.231 \\
sin\_3 & 79.5388 & 17.170 & 4.633 & 0.000 \\
cos\_3 & 40.4587 & 16.802 & 2.408 & 0.016 \\
sin\_4 & -13.3373 & 16.827 & -0.793 & 0.428 \\
cos\_4 & -10.7505 & 16.822 & -0.639 & 0.523 \\
sin\_5 & -24.8776 & 16.962 & -1.467 & 0.143 \\
cos\_5 & 12.4523 & 17.012 & 0.732 & 0.464 \\
sin\_6 & 1.0620 & 16.883 & 0.063 & 0.950 \\
cos\_6 & -12.7196 & 16.719 & -0.761 & 0.447 \\
sin\_7 & -4.3845 & 16.756 & -0.262 & 0.794 \\
cos\_7 & 19.6560 & 16.769 & 1.172 & 0.241 \\
\hline
\end{array}
Table 7. Summary of blood usage model
The signs of these estimates are consistent with a previous study [1], providing evidence that the model is well-identified.
3.3. Effects of Promotions
The Korean Red Cross employs promotional methods such as additional giveaways and sending blood donation request messages to address blood shortages. Among these methods, the additional giveaway promotion was conducted uniformly across all regions over a long period, rather than as a one-time event. For this reason, the effect of this promotion was primarily analyzed. Park (2018)[18] showed the impact of promotions on blood donors, but it was based on a survey and had limitations in that quantitative changes could not be measured.
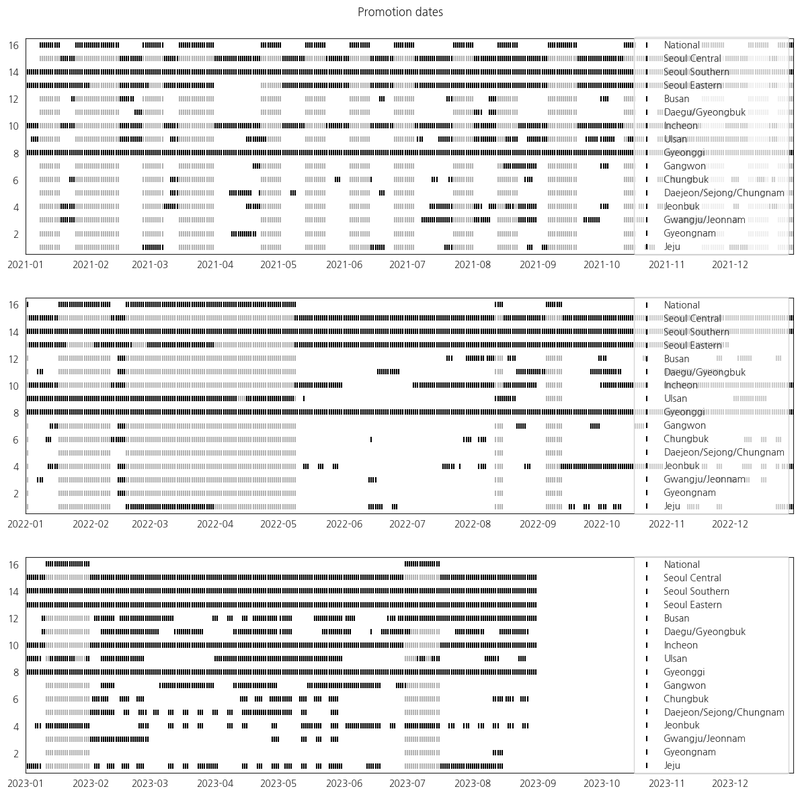
The effect of the additional giveaway promotion on the number of blood donors was confirmed by using promotion days as a dummy variable while controlling the exogenous factors considered earlier. To control the trend effect that could occur due to the clustering of promotion days (Figure 3), the entire period was divided into quarters, and the effect of promotions was measured within each quarter. To prevent outliers that could occur due to data imbalance within the quarter, only periods where the ratio of promotion days within the period ranged from 10% to 90% were used for the analysis. The Seoul, Gyeonggi, and Incheon regions were excluded from the analysis as the promotions were always carried out, making comparison impossible. Due to the nature of the dependent variable being affected by various social factors, the effect of promotions showed variance, but the mean of the distribution was estimated to be positive for all groups (Figure 4, Table 8).
In addition to the additional giveaway promotion, the Korean Red Cross conducts various special promotions. Special promotions include all promotions other than the additional giveaway promotion. As special promotions are conducted for short periods, trend effects cannot be eliminated by simply using dummy variables. Therefore, the net effect on the number of blood donors during special promotion periods was measured by comparing the number of donors during the promotion period with two weeks before and

\begin{array}{llr}
\hline
\textbf{Region} & \textbf{Gender} & \textbf{Average Promotion Effect} \\
\hline
\text{Gangwon}& \text{Male} & 20.2\% \\
& \text{Female} & 16.3\% \\
\hline
\text{Gyeongnam}& \text{Male} & 14.4\% \\
& \text{Female} & 4.1\% \\
\hline
\text{Gwangju/Jeonnam}& \text{Male} & 9.6\% \\
& \text{Female} & 14.4\% \\
\hline
\text{Daegu/Gyeongbuk}& \text{Male} & 18.5\% \\
& \text{Female} & 16.8\% \\
\hline
\text{Daejeon/Sejong/Chungnam}& \text{Male} & 17.7\% \\
& \text{Female} & 12.9\% \\
\hline
\text{Busan}& \text{Male} & 19.0\% \\
& \text{Female} & 14.1\% \\
\hline
\text{Ulsan}& \text{Male} & 5.3\% \\
& \text{Female} & 14.1\% \\
\hline
\text{Jeonbuk}& \text{Male} & 9.9\% \\
& \text{Female} & 12.2\% \\
\hline
\text{Jeju}& \text{Male} & 5.5\% \\
& \text{Female} & 8.7\% \\
\hline
\text{Chungbuk}& \text{Male} & 11.0\% \\
& \text{Female} & 19.2\% \\
\hline
\end{array}
Table 8. Gender and region-wise promotion effect
after the promotion. Among various special promotions, the sports viewing ticket give- away promotion showed a high performance in several regions: Gangwon (basketball), Gwangju/Jeonnam (baseball), Ulsan (baseball), and Jeju (soccer) Table 9.
\begin{array}{l|r|r}
\hline
\textbf{Region} & \textbf{Rank of the sports promotions} & \textbf{The number of special promotions} \\
\hline
\text{Gangwon} & 1st & 4\\
\text{Gyeongnam} & N/A & 9\\
\text{Gwangju/Jeonnam} & 1st, 3rd, 4th & 6\\
\text{Daegu/Gyeongbuk} & N/A & 7\\
\text{Daejeon/Sejong/} \\ \, \text{Chungnam} & N/A & 11\\
\text{Busan} & N/A & 6\\
\text{Ulsan} & 2nd & 4\\
\text{Jeonbuk} & N/A & 6\\
\text{Jeju} & 2nd & 7\\
\text{Chungbuk} & N/A & 7\\
\hline
\end{array}
Table 9. Performance of sports viewing ticket giveaway promotions by region
4. Conclusion
Previous studies had the limitation of not being able to quantitatively measure changes in blood stock during the COVID-19 pandemic and blood shortage situations. Furthermore, the effect of blood donation promotions on the number of blood donors in Korea has not been studied.
This study quantitatively analyzed changes in supply and usage during the pandemic and blood shortage situations, as well as the impact of various promotions, using exogenous variables, including time series variables, as control variables. According to the findings of this study, a stable blood supply can be achieved by improving the low promotion response in the Ulsan-si and Jeju-do regions and implementing sports viewing ticket giveaway promotions nationwide.
This study was conducted using short-term regional grouped data due to constraints in data collection. Given that blood donation centers within a region are not homogeneous and the characteristics of blood donors change over time, future research utilizing long-term individual blood donation center data and promotion data could significantly enhance the rigor and granularity of the analysis.
References
[1] Eunhee Kim. Impact of the covid-19 pandemic on blood donation. 2023.
[2] JunSeok Yang. The relationship between attitude on blood donation and altruism of blood donors in gwangju-jeonnam area. 2019.
[3] Jihye Yang. The factor of undergraduate student’s blood donation. 2013.
[4] Eui Yeong Shin. A study on the motivations of the committed blood donors. 2021.
[5] Dong Han Lee. Segmenting blood donors by motivations and strategies for retaining the donors in each segment. 2013.
[6] Shin Kim. A study on prediction of blood donation number using multiple linear regression analysis. 2015.
[7] Republic of Korea. Blood management act, 2023.
[8] Korean Red Cross Blood Services. 2022 annual statistical report on blood services, 2022.
[9] Korean Red Cross Blood Services. Daily data for the number of blood donors, blood usage, blood stock, and promotion dates, 2023.
[10] KoreaMeteorologicalAdministration.Automatedsynopticobservingsystem,2023.
[11] Korea Astronomy and Space Science Institute. Special day information, 2023.
[12] Peter C Young, Diego J Pedregal, and Wlodek Tych. Dynamic harmonic regression. Journal of forecasting, 18:369–394, 1999.
[13] H Akaike. Information theory as an extension of the maximum likelihood principle. A ́ in: Petrov, bn and csaki, f. In Second International Symposium on Information Theory. Akademiai Kiado, Budapest, pp. 276A ́281, 1973.
[14] Su mi Lee and Sungjo Hong. The effect of weather and season on pedestrian volume in urban space. Journal of the Korea Academia-Industrial cooperation Society, 20:56–65, 2019.
[15] Republic of Korea. Framework act on the management of disasters and safety, 2023.
[16] Hye Jin Bae, Byong Sun Ahn, Mi Ae Youn, and Don Young Park. Survey on blood donation recognition and korean red cross’ response during covid-19 pandemic. The Korean Journal of Blood Transfusion, 32:191–200, 2021.
[17] Statistics Korea. Sk telecom mobile data, 2020.
[18] Seongmin Park. Effects of blood donation events on the donors’ intentions of visit in ulsan. 2018.