Forecasting Demand for Public Bicycling in Seoul to Optimize Bike Repositioning at Rental Stations
Published
Sungsu Han*
* Swiss Institute of Artificial Intelligence, Chaltenbodenstrasse 26, 8834 Schindellegi, Schwyz, Switzerland
This study aims to improve operational efficiency by optimizing the relocation of Seoul's public bicycles, “ Seoul Bike.” The highlights of the study include Analyzing the usage patterns of Seoul Bike: We analyzed the bicycle travel patterns between business and residential areas, focusing on rush hour.
Introduced the concept of spatiotemporal equilibrium: We proposed the concept of “equilibrium,” where borrowing and returning are balanced in a daily cycle, to provide a basis for relocation strategies.
Developed a data-driven prediction model: We used a SARIMAX model to predict usage by rental location, taking into account variables such as weather, time of day, and location. Optimized relocation strategy: Introduced the D-Index to identify borrowing stations that needed to be relocated, and clustering using the Louvain algorithm to establish efficient relocation zones.
Visualization tool development: We created a visualization tool to intuitively understand bicycle movement patterns and relocation strategies by time of day. This study suggests ways to increase the efficiency of public bicycle operations and improve user satisfaction through a data-driven scientific approach. The results of this study are expected to help Seoul Bike, Seoul reduce operating costs and improve service quality.
This paper will be organized as follows.
For the sake of readability, I'm going to divide this article which may seem long and complicated with multiple stories into 5 section.
In the first section, I'll talk about why I became interested in Seoul Bike and the question “Where are the best places to ride Seoul Bike in Seoul?”. In section 2, I would like to talk about the environmental benefits of public bicycle rental in Seoul and what are the biggest problems with this hot item that can solve the health problems of Seoul office workers.
Through this, I will talk about what causes the public bicycle business to always be in the red and analyze the operating costs of the public bicycle industry to lay the groundwork for my thesis topic. In the third section, I will analyze the usage patterns of Seoul Bike from the perspective of users of Seoul Bike in Seoul to lay the groundwork for the core concept of this thesis, equilibrium, which will be discussed in section 4.
In the fourth section, I will discuss specific ideas on how to forecast the usage of each Seoul Bike rental center to solve the deficit of Seoul Bike in Seoul. Finally, we will talk about additional ideas that can maximize the utility of the previous ideas and describe the datasets that can be applied to them.
We'll also talk about the implications of Seoul Bike's work on the Han River bike path and conclude with a discussion of the implications for the future.
Keywords: Seoul Bike, User Patterns, Rental Stations
1. Introduction
1.1. Background
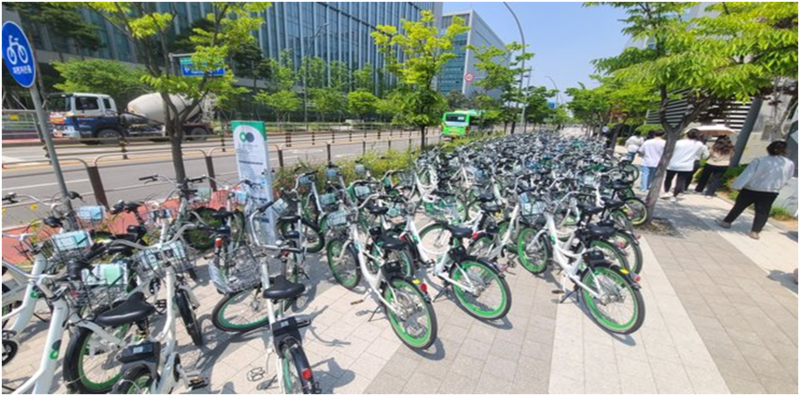
I am a researcher who commutes from Goyang City to my office near Magok Naru Station in Seoul. One day on my way to work, I rubbed my sleepy eyes as I stepped off the shuttle and was surprised to see hundreds of green bicycles.
I usually commute to work on the company shuttle, but I've recently gotten into cycling, and when the weather is nice, I even bike from home to work. The biggest reason I got into cycling is because of the positive image of Seoul Bike, the city's public bicycle program.
The question “Where did all those hundreds of bicycles at Magok intersection on my way to work come from?” [figure 1-1-1] stuck in my mind for a while, and I realized that I could combine my interest in bicycles with my thesis on public bicycle projects.
1.2. Problem Statement
Seoul Bike, the city's public bicycle program, has grown rapidly since its introduction in 2015, with great support from Seoul citizens. As of 2023, more than 43,000 bicycles were in operation at more than 2,700 rental stations, and the cumulative number of subscribers exceeded 4 million, making it one of the city's most successful policies. This has had a variety of positive effects, including reducing traffic congestion, addressing air pollution, and improving the health of citizens.
But with this rapid growth has come a number of challenges. The city of Seoul runs a deficit of around 10 billion won every year. This is due to low user fees and high operating costs due to the nature of the public service.
There is a shortage or surplus of bicycles in certain time zones and neighborhoods. This causes inconvenience to users and reduces service efficiency. As of 2019, Seoul Bike had only 60 maintenance staff to manage 25,000 bikes, resulting in an increase in broken bikes and poor management of rental stations. Irresponsible use, vandalism, and loss of bikes are causing additional management costs.
1.3. Aims and Objectives
To address these issues, this study aims to develop a demand prediction model for each Seoul Bike rental station: Develop a model that accurately predicts the demand for each bike rental station by time of day and day of the week by utilizing time series analysis and machine learning algorithms. Based on the predicted demand, we optimize the number of bikes at each rental location to solve the problem of demand-supply imbalance.
Reduce unnecessary relocation costs, increase user satisfaction, and improve overall operational efficiency through accurate demand forecasting and optimized deployment. The developed model provides data-driven decision support for critical operational decisions, such as selecting new rental station locations and deciding to purchase additional bikes.
1.4. Summary of Contributions and Achievements
This study aims to improve operational efficiency by optimizing the relocation of Seoul's public bicycles, “Seoul Bike.” The highlights of the study include analyzing the usage patterns of Seoul Bike: We analyzed the bicycle travel patterns between business and residential areas, focusing on rush hour.
Introduced the concept of spatiotemporal equilibrium: We proposed the concept of “equilibrium,” where borrowing and returning are balanced in a daily cycle, to provide a basis for relocation strategies.
Developed a data-driven prediction model: We used a SARIMAX model to predict usage by rental location, taking into account variables such as weather, time of day, and location. Optimized relocation strategy: Introduced the D-Index to identify borrowing stations that needed to be relocated, and clustering using the Louvain algorithm to establish efficient relocation zones.
Visualization tool development: We created a visualization tool to intuitively understand bicycle movement patterns and relocation strategies by time of day.
This study suggests ways to increase the efficiency of public bicycle operations and improve user satisfaction through a data-driven scientific approach. The results of this study are expected to help Seoul Bike, Seoul reduce operating costs and improve service quality.
2. Solution Approach
2.1. Best Place to Ride a Seoul Bike
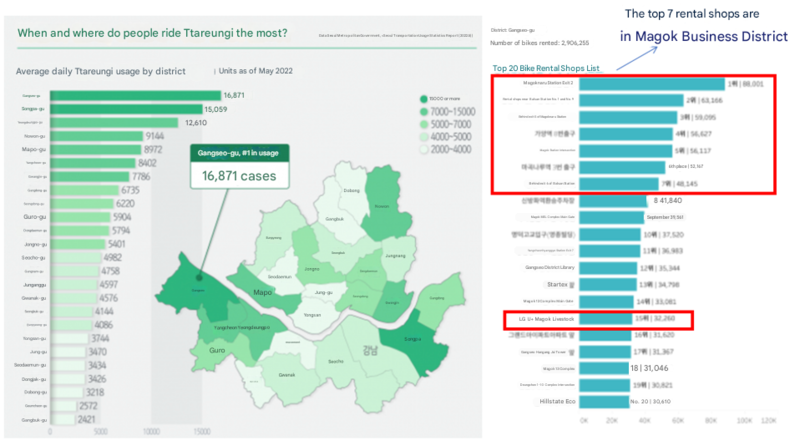
According to the Seoul 2022 Transport Usage Statistics Report, Gangseo-gu is the most populated bike traffic district in Seoul, and within Gangseo-gu, seven locations near the Magok business district ranked among the top.
This is probably due to the nature of the Magok business district. Magok is a large, recently developed business complex with a high concentration of office workers. As a new development, the area is well equipped with infrastructure such as cycle paths. Its proximity to the Han River bike path makes it convenient for both commuting and leisure use.
Bicycle commuting is becoming increasingly popular due to growing environmental and health concerns. On the other hand, Goyang City's public bike "Fifteen" was closed due to losses, showing that it is not easy to ensure profitability in the public bike business. In the case of Seoul Bike, the company runs a deficit of more than 10 billion won every year, so it needs to find ways to operate sustainably.
2.2. The Cause of The Public Bike Projects' Deficit
The issue of deficits in the public bicycle business and the analysis of relocation costs is a very important topic.
Reducing the cost of relocating bicycles is likely to be the most effective way to reduce the deficit of the public bicycle project. Analyzing the usage patterns of users in Seoul Bike to optimize the relocation of bicycles will contribute to reducing the deficit.
Based on this analysis, it is important to explore efficient operational measures to increase the sustainability of the public bicycle business. Along with establishing specific strategies to reduce relocation costs, it is likely that a variety of approaches will be needed, including engaging users and diversifying revenue.

Nubiza (Changwo): KRW 4.5 billion, Tashu (Daejeon): KRW 3.6 billion, Tarangae (Gwangju): KRW 1 billion, Eoulling (Sejong): KRW 0.6 billion, Seoul Bike (Seoul): Over KRW 10.3 billion

The cost of relocating bikes is the largest component, accounting for around 30 per cent of total operating costs. Relocation costs of KRW 525 million, about 30% of total maintenance costs of KRW 1.78 billion.
Relocation costs of KRW 525 million: On-site distribution - KRW 375 million, Relocation vehicle operating costs - KRW 150 million
2.3. Time of Day Usage Patterns of Seoul Bike Users
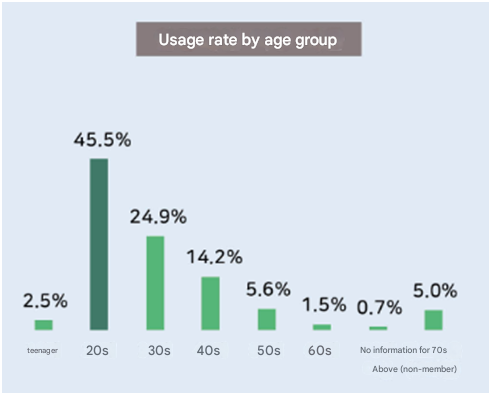
First, let's look at the usage patterns by time of day. On weekdays, the usage is concentrated at 7-8am and 5-6pm, which are commuting hours, suggesting that Seoul Bike is mainly used for commuting. However, on weekends, the usage is relatively evenly distributed from 12 noon to 6 pm, suggesting that it is used for leisure activities or going out. Next, let's look at the user characteristics. In terms of age, users are mainly in their 20s and 30s. This shows that Seoul Bike is becoming a popular means of transport for young people. In addition, the purpose of use is mainly commuting on weekdays and leisure activities on weekends.
Next, we look at the most important regional clusters. Regional clustering is characterized by a tendency for Seoul Bike to be concentrated in large business districts, areas with well-developed infrastructure such as bike paths, and areas with easy access to the Han River. In particular, it is more popular in areas with easy access to subway stations and workplaces. Representative areas include Magok District in Gangseo-gu, Songpa-gu (Lotte World Tower in Jamsil), Yeongdeungpo-gu (Yeouido business district), and Seongdong-gu .
2.4. Summary
Cycling has become a popular mode of transport for commuting and leisure activities, especially among young people, and tends to be concentrated in large business districts and areas with well-developed cycling infrastructure. These findings suggest that cycling is more than just a mode of transport, but is influencing urban transport systems and lifestyles. Taken together, these findings suggest that cycling policies need to take into account the characteristics of each neighbourhood and focus management and investment on areas with high usage. It is also necessary to consider changes in demand by time of day, with bicycle deployment needing to be adjusted to meet different demands during rush hour and on weekends.
3. Methodology
As we mentioned in Chapter 2, we were able to find out that among the newly developed business districts in Seoul, the business districts where bicycle paths are well-constructed and where access to the Han River bicycle path is easy are the ones where Seoul Bike usage is concentrated.
We will start the analysis by focusing on the super-large business districts that are the cause of the concentration of Seoul Bike usage.
So we have come up with a hypothesis. It is a concept called equilibrium. The idea is that if rentals and returns are equilibrium based on the rental station, there is no need for additional reallocation. To this end, the goal of this paper is to reduce the deficit by improving the efficiency of Seoul Bike reallocation by predicting bicycle rentals and returns.
3.1. Correlation of 24-hour weather data with rental demand
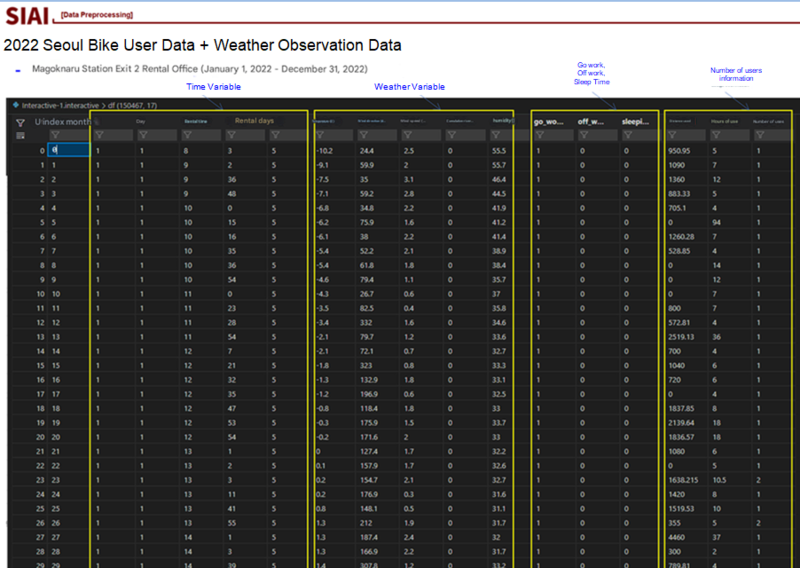
First, in order to confirm the correlation between the Seoul Bike rental data and the weather, pre-processing was performed to integrate Seoul Bike usage information and weather based on the time variable. In addition, in order to identify the phenomenon of rush hour and rush hour, the time was divided as follows.
The preprocessed data below is data from January to December 2022 at the rental office at Exit 2 of Magoknaru Station. From the leftmost column, the time variables are month/day rental time rentals and day of the week, and the weather variables are temperature, wind direction, wind speed, and accumulated precipitation. In addition, Seoul Bike usage information was added to the right column and preprocessed.
Let's first look at the correlation between the preprocessed data and weather data based on the number of users per minute. First, when looking at the wind speed, the stronger the wind, the more the usage tends to decrease. The highest Seoul Bike usage was at the 3m/s level, which can be felt as a gentle breeze rather than no wind at all.
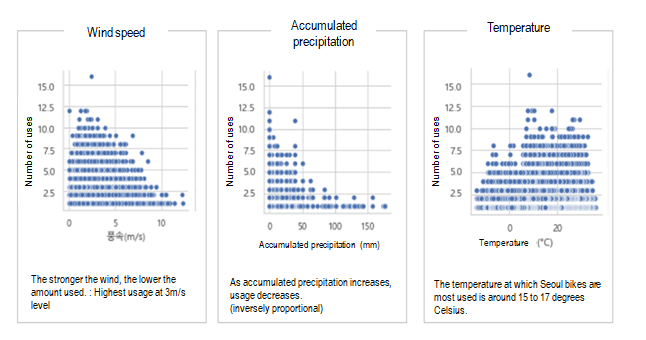
Also, since the accumulated precipitation is inversely proportional to the number of users, it seems to match the general idea that people will not ride bicycles as much as they would use Seoul Bike when it rains. Lastly, the temperature was the highest when people think it is a little cool, around 15~17 degrees, but it was confirmed that the usage was low when it was too cold or too hot.
The correlation with temperature is expected to have seasonality as the Seoul Bike rental volume is correlated with the season. Therefore, we plan to conduct a time series analysis using SARIMAX using external weather variables for the remaining residuals after dividing them into seasonality and trend using STL Decomposition.
3.2. Seoul Bike Daily Return Pattern
In this part, we will analyze the return volume data of Seoul Bike rental stations for 4 years to check the seasonality of the return volume of Seoul Bike rental stations and perform STL Decomposition.
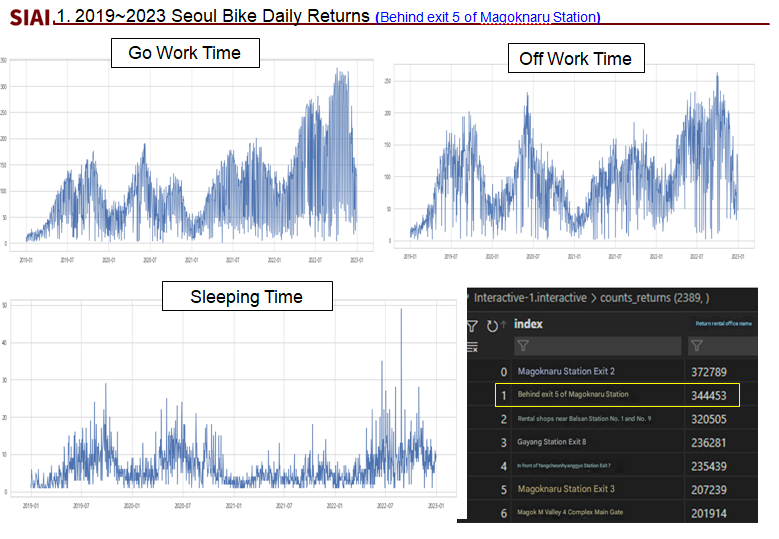
Before conducting a time series analysis to predict the demand for bicycles by Seoul Bike rental station, we drew the daily return volume of Seoul Bike behind Exit 5 of Magoknaru Station from 2019 to 2023. The reason why we did not select Exit 3 of Magoknaru Station, which has the largest number, is because it is a recently built station and there is no data for 19-20 years, so we selected the rental station behind Exit 5 of Magoknaru Station.
We drew a graph of the return and rental during commuting hours of the rental station behind Exit 5 of Magoknaru Station and the cumulative amount, which is the value of the return minus the rental. You can see that the number of bicycles increases as the years go by, and that there is seasonality with the lowest usage in winter and the highest usage in spring and fall.
3.3. Modeling of Seoul bike cumulative volume during commuting hours
The number of rentals and returns is symmetrical overall, but you can see that it is biased over time. (There are more returns during commuting hours: returns > rentals)
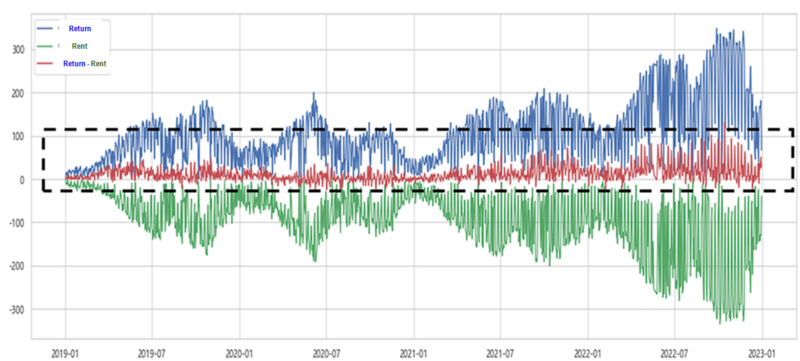
The cumulative amount representing the number of bicycles in the rental station is expressed as the difference between the number of returns and the number of rentals, and has a trend and seasonality. This means that the use of STL Decomposition, a pre-processing step for time series analysis, is necessary.
The following diagram is a graphical representation of the cumulative amount during go work Time in the business district.
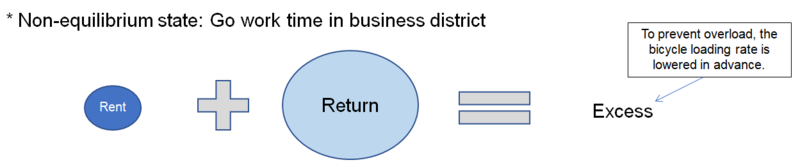
And when you look at the cumulative amount, you can see that the number of returns is a very large proportion compared to the number of rentals, and there is an excess of bicycles.
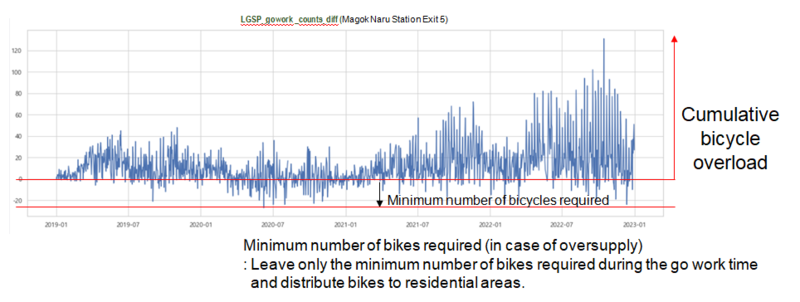
This suggests that the bikes in the business area should be distributed to other areas, leaving only the minimum number of bikes needed in the early morning hours.
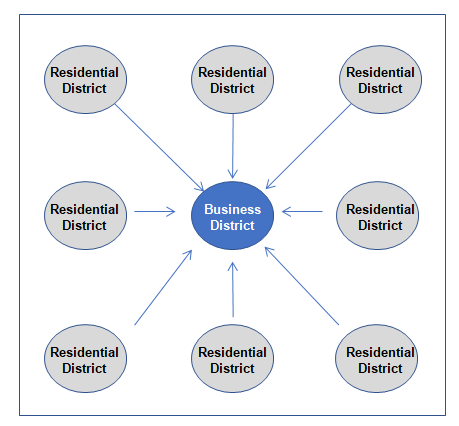
As expected from the graphs above, there is a significant concentration of bikes rented in the morning hours from residential districts to business districts.
This could be a reason to have more racks in business areas than in residential districts.
3.4. Bike Demand Forecasting by using SARIMAX Modeling
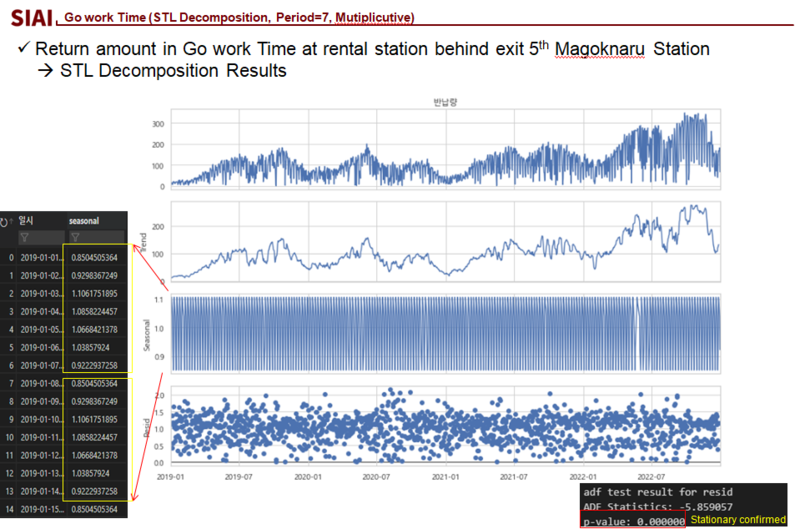
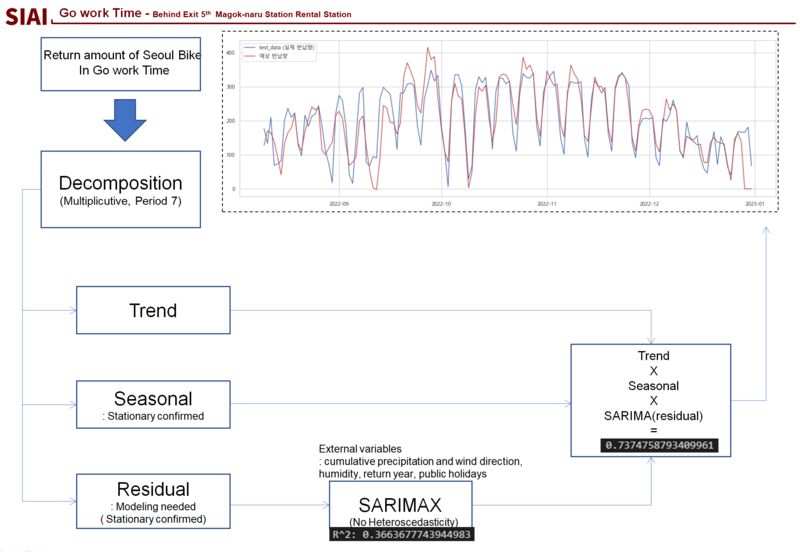
3.4.1. Return amount in go work time - STL Decomposition results
The return amount of the rental office behind Exit 5 of Magok Naru, which we looked at earlier, was decomposed into Seasonal Trend Loess (Local regression). This is the result of extracting the trend and periodicity included in the time series data through STL Decomposition with the period set to 7 days and using the Multiplicative Option.
3.4.2. Decomposition(Residual) Modeling - SARIMAX Results
We conducted time series analysis using SARIMAX on the residuals from the STL Decomposition discussed above.
We added weather data and time variables and used them as external variables. When we modeled the residuals from the STL Decomposition using SARIMAX, the results are as follows.
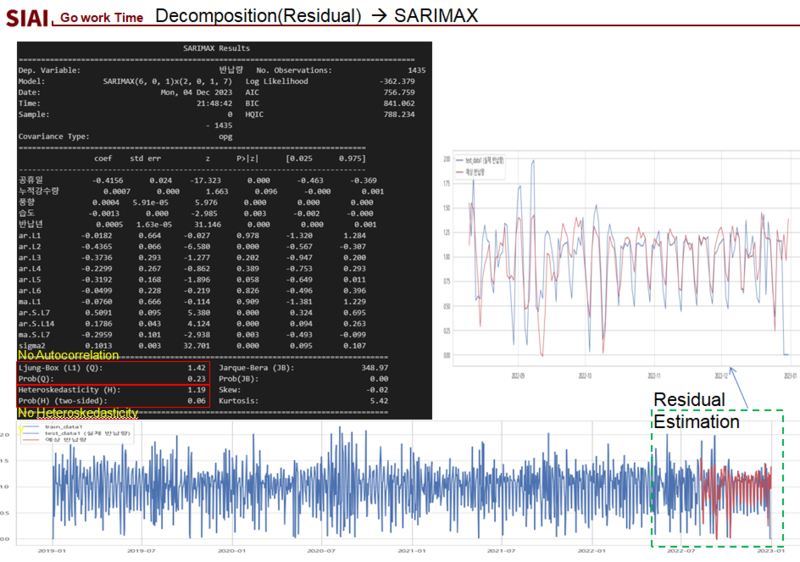
When the ADF Test was conducted separately, the results showed that stationary was secured, and when looking at the Ljung Box results after running SARIMAX, the P-Value was greater than 0.05, so there was no autocorrelation, and the Heteroskedasticity test results also showed that there was no heteroscedasticity because the P-Value was greater than 0.05. The results when using 90\% of the 4-year return volume data of the rental office behind Exit 5 of Magoknaru Station during rush hour as Train Data and predicting the remaining 10\% are as follows.
When the residuals with secured normality were predicted using the SARIMAX model with the cumulative precipitation and wind direction humidity return years as external variables, it was confirmed that heteroscedasticity was eliminated, and when the return amount was predicted using this modeling, it was confirmed that the R2 value was approximately 0.73.
3.5. Logic for improving the efficiency of bicycle relocation
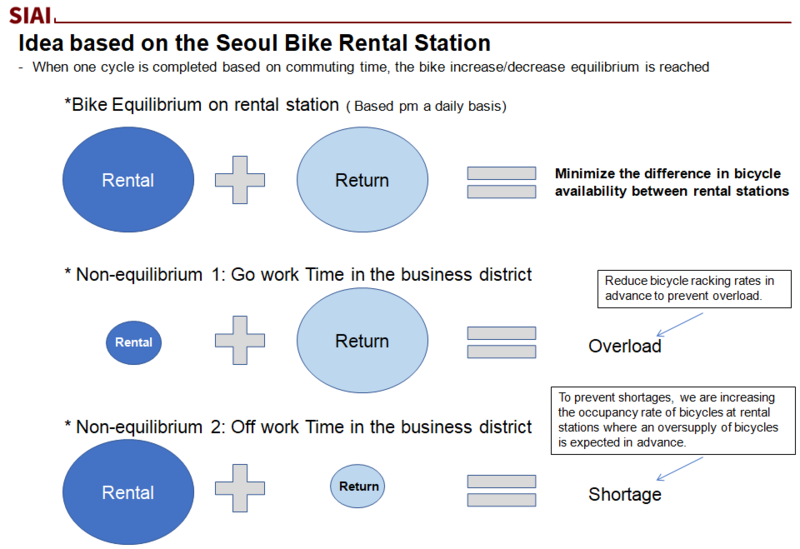
So, the idea that we have thought about based on the Seoul Bike rental stations we have seen so far is the concept of equilibrium. If we group a day into 1 cycle based on commuting hours, it is a concept that a state of equilibrium of bicycle increase and decrease comes. If we summarize it, it can be explained as shown in the figure below.
In addition, the non-equilibrium state is a pattern that can be confirmed by limiting it to the commuting and returning hours of the business area. The non-equilibrium state 1 (commuting hours) where there is an excess of bicycles during the morning commuting hours when returns are the main thing, and the non-equilibrium state 2 (commuting hours) where there is a shortage of bicycles during the afternoon commuting hours when rentals are the main thing can be diagrammed as shown below.
Ultimately, the core logic of this paper is to predict the user factor and determine the optimal redistribution factor in order to resolve the temporal Seoul Bike non-equilibrium of commuting and returning hours.
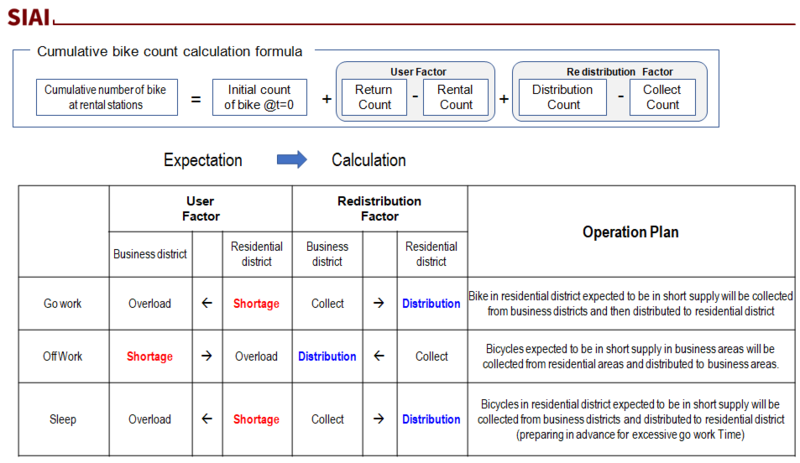
To summarize the content so far, the areas where Seoul Bike reallocation is most necessary are areas with a large imbalance in bicycle rentals and returns in the super-large business districts where the most rentals and returns occur during commuting hours. (Example: Gang-seo LGSP)
Since people who ride Seoul Bike to work are more likely to ride Seoul Bike home, it would be more efficient to place them only in areas where demand is expected to be excessively high in the afternoon and a shortage is expected, rather than evenly reallocating bicycles that were crowded in the morning by utilizing the equilibrium state.
Also, since a shortage is more likely to cause dissatisfaction with Seoul Bike use than an excess, it is important to predict a shortage rather than an excess, which is the summary of the ideas derived so far.
3.6. Seoul Bike cost efficiency solution according to 1-Day Index Range
In order to create a logic for selecting the rental stations to be relocated, the 1 Day Seoul Bike equilibrium state Index can be selected as the ratio of the expected rental volume and the expected return volume, and the equilibrium state and non-equilibrium state can be divided.
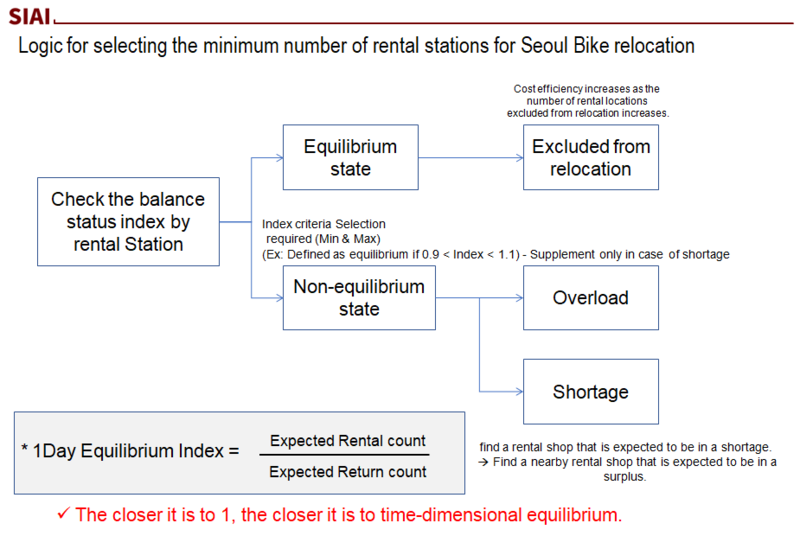
The wider the range of the Index 1 is selected, the more rental stations are excluded from the relocation target, which reduces the cost. In addition, the non-equilibrium state is divided into excess and shortage states, and the relocation is carried out mainly in the shortage state, so that the Seoul Bike bike relocation is carried out in a way that maximizes customer satisfaction.
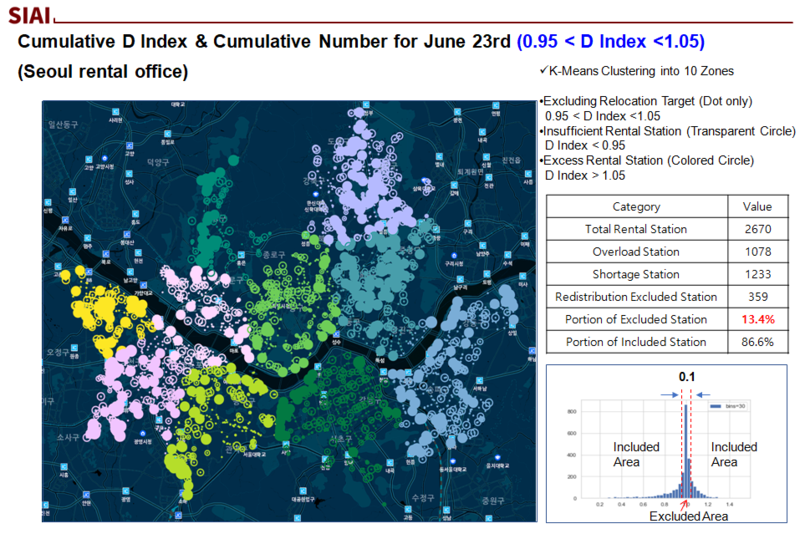
In order to verify this logic for selecting the rental stations to be relocated to the Seoul Bike, we first looked at the distribution of the Seoul Bike Index and the cumulative amount. The distribution of the D Index and the cumulative number for June 2023 was expressed as a violin plot and histogram.
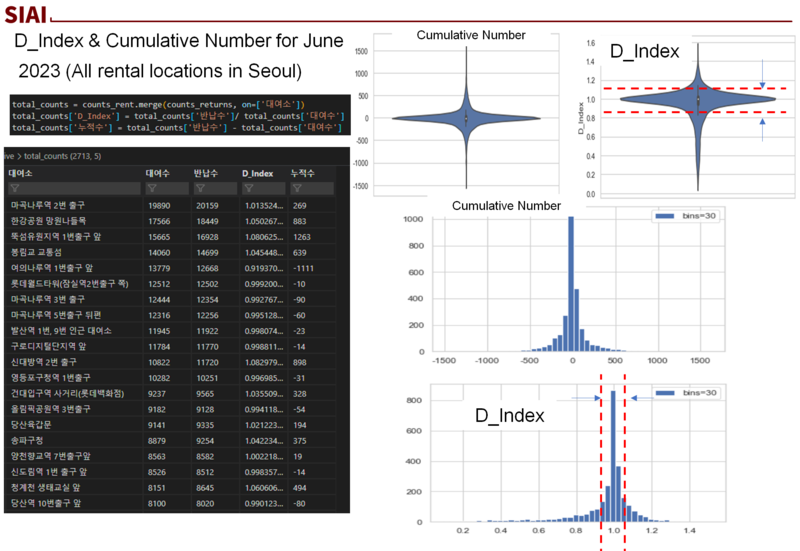
The cumulative number, which is the return amount minus the rental amount, mostly had a ratio of 0, and the D Index, which is the ratio of the return amount to the rental amount, had a ratio of 1.
This can be seen as confirming a certain degree of equilibrium between the rental and return amounts of the Seoul Bike mentioned earlier. Therefore, I visualized the efficiency of Seoul Bike reallocation using the temporal equilibrium state through the D Index mentioned earlier.
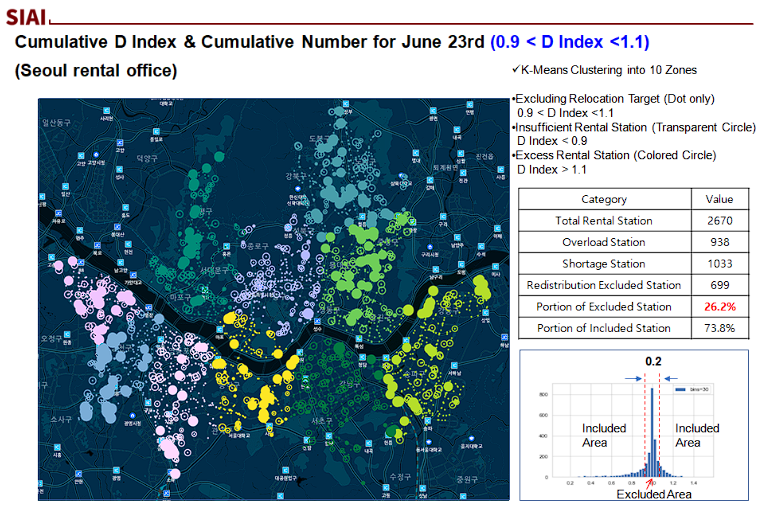
The reduction in Seoul Bike reallocation cost using the D Index Range can be flexibly managed by flexibly adjusting the ratio of the Seoul Bike D Index as shown in the figure below.
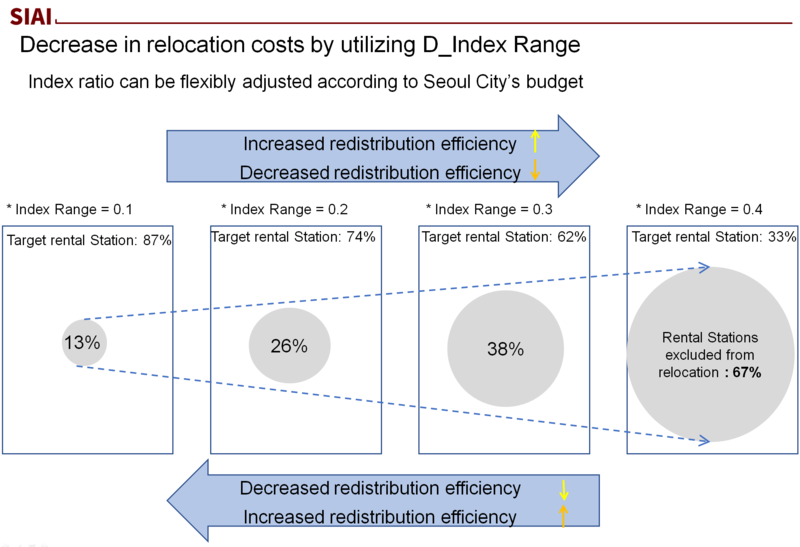
As we have seen above, efficient operation is possible by increasing the Index Range excluding relocation and reducing the relocation cost, and it is also possible to operate by flexibly adjusting the Index ratio according to the allocated cost of the Seoul City Seoul Bike budget.
The example presented below is visualized data when the Seoul City operation unit is divided using K-Means Clustering and the D Index Range is flexibly operated from 0.1 to 0.4.
This is the result of diagramming the entire Seoul City using the same method as the Gangseo-gu visualization data confirmed earlier.
In the case of the minimum Index Range excluding relocation target rental stations of 0.1, the ratio of excluded rental stations is 13.4\% and the ratio of target rental stations is 86\%, which is a high ratio. This case will be the most expensive and the relocation efficiency is bound to be low.
Range
In the case where the Index Range for the target rental stations is 0.4, which is the maximum, the ratio of rental stations excluded from the target rental station relocation is 66.6\%, and the ratio of rental stations targeted for relocation is low at 33.4\%.
In this case, the cost of relocation for Seoul bike will be greatly reduced, and the relocation efficiency can also be the highest.
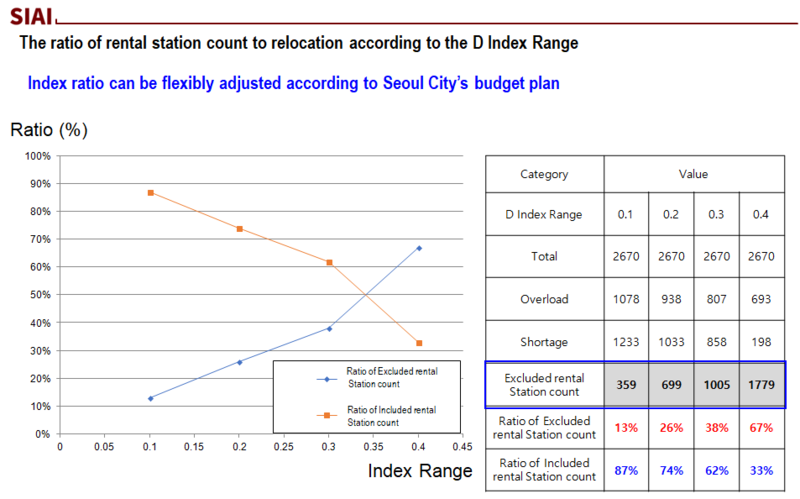
If the ratio of rental stations relocated according to the D Index Range is operated with a focus on practicality, the Index ratio can be flexibly adjusted according to the Seoul Metropolitan Government's Seoul bike budget.
As we have seen above, the ratio of rental stations excluded and rental stations targeted has a trade-off tendency,
and the more the ratio of rental stations excluded using the Seoul bike D Index is increased, the fewer bicycles will be targeted for relocation, which can reduce the relocation cost.
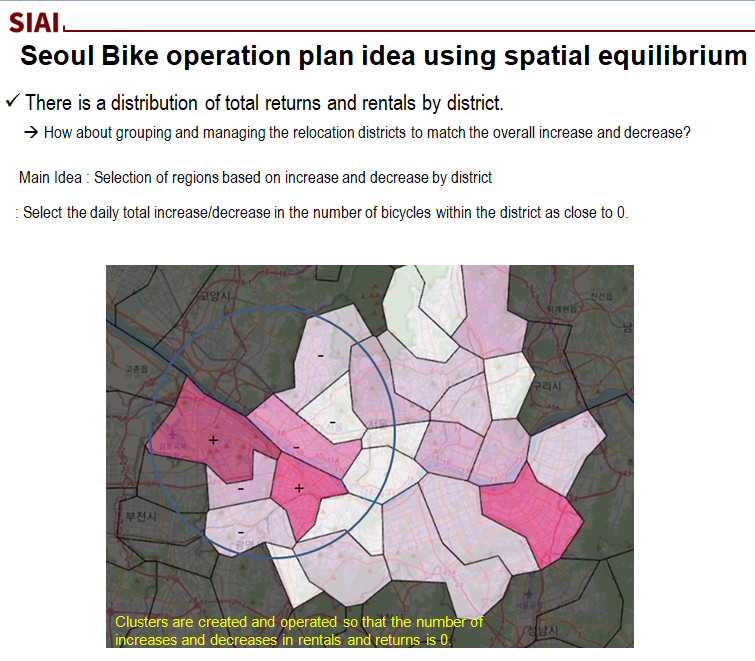
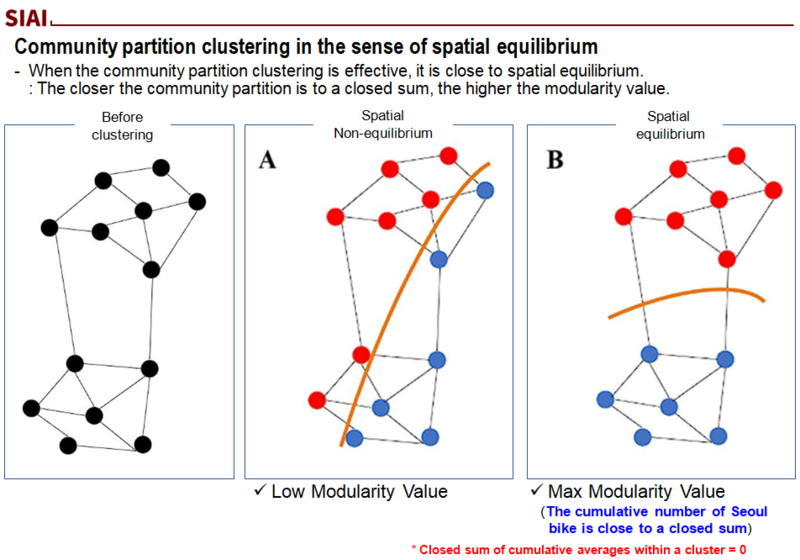
3.7. Seoul Bike operation plan idea using spatial equilibrium
Using the spatial equilibrium examined so far, we have come to think that clustering is necessary to minimize the distance of bicycle redistribution movement by using the distribution of total returns and rentals by district, and clustering that has a partial sum where business districts and residential districts are grouped as a pair.
Since there is a distribution of total returns and rentals by district, we thought about how about managing the redistribution districts by grouping them according to the overall increase and decrease.
Therefore, if the selection of districts according to the increase and decrease by district is selected so that the total daily cumulative number of bicycles within the district is close to 0, there is no need to exchange Seoul Bike between the set districts for redistribution, and the effect of reducing the distance of redistribution bicycles within the district area can be achieved, which leads to improved redistribution efficiency overall because the travel distance of redistribution trucks is reduced.
Index Range
3.7.1. Clustering application idea for implementing spatial equilibrium of Seoul Bike
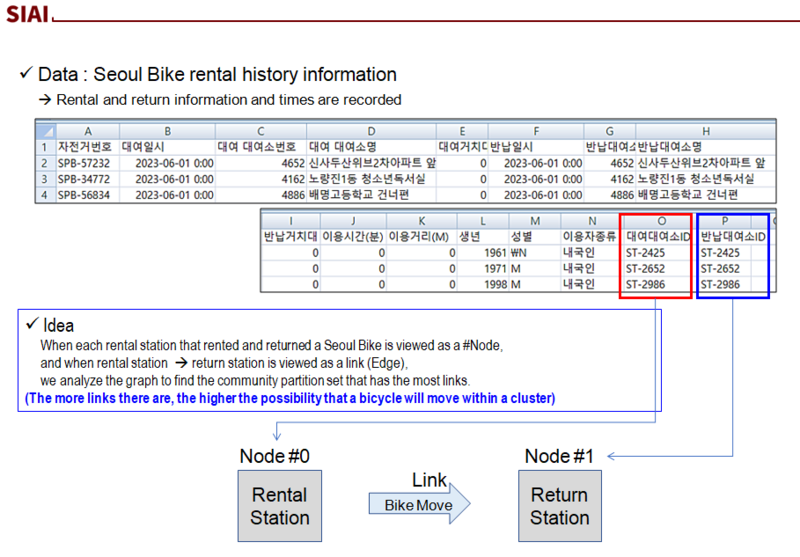
To represent the spatial equilibrium as a mathematical vector, we can think of moving from a rental station node to a return station node as a link.
With this idea, we converted Seoul bike rental information into graph data and then came up with the idea of finding a community partition set with the most links.
3.7.2. What is Network Community Detection?
The problem of dividing a graph into several clusters is called Community Detection.
While thinking about the algorithm to apply to the idea I thought of earlier, I thought about using a cluster detection algorithm that can be used for Seoul Bike movement network data.
The basic concept is that ‘groups with high connection density are tied together’, and the algorithm that calls a group that is tied together and more tightly tied (with high modularity) a Community is defined as Network Community Detection.
3.7.3. What is Modularity?
Here, we will learn more about the definition of Modularity, a concept that can quantify the concentration of Network Nodes.
First, the definition of Modularity quantifies the degree to which Nodes are concentrated based on Links in a network structure. The purpose is to measure the structure of a structurally divided network (graph), and the degree of modularity of the network can be expressed as a value of -1 to 1. A value of around 0.3 to 0.7 can be said to indicate a significant cluster.
It can be said to be an Index with a large value when there are many connections within a distinct group within the network and few connections between groups.
The definition of the Index is defined as the ratio of the density of [links within a community] and [links between communities].
For example, a network with high modularity has dense connections between nodes within a module, so the clustering ratio of the same area is high, and the connections between nodes in other modules are sparse, indicating clustering in other areas, which is expressed as a modularity value close to 0.
Modularity
- Quantifies the degree to which nodes are clustered based on links in a network structure
- Measures the structure of a structurally divided network (graph)
- Indicates the degree of modularity of a network with a value of -1 to 1 (significant clustering of 0.3 to 0.7)
- A measure that indicates the property that there are many connections within a distinct group in a network and few connections between groups
- : Defined as the ratio of the density of [inter-community links] and [inter-community links]
* A network with high modularity has dense connections between nodes within a module (clustering in the same area) but sparse connections between nodes in different modules (clustering in different areas).
3.7.4. Introduction to Louvain Algorithm
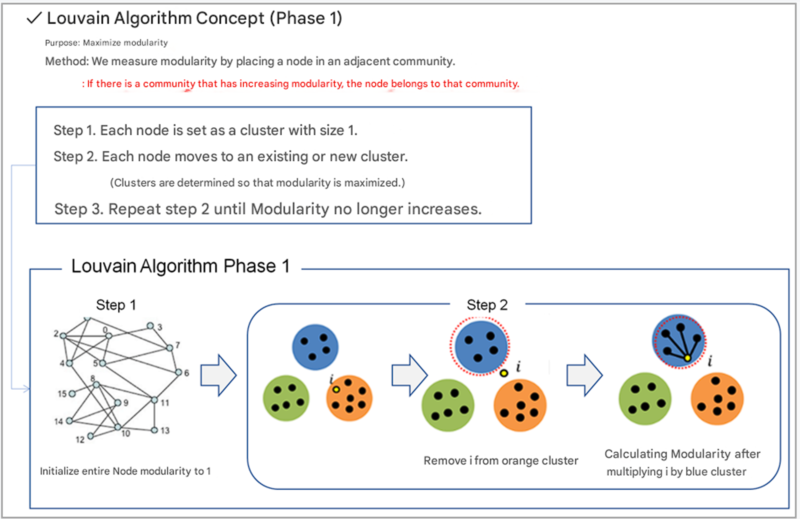
Among the algorithms that utilize modularity, we decided to verify the idea through the Louvain algorithm, a representative algorithm. The Louvain algorithm is divided into Phase 1 and Phase 2.
The purpose of Phase 1 is to maximize modularity. The method is to measure modularity by placing a node in another adjacent community and determine the cluster so that modularity is maximized.
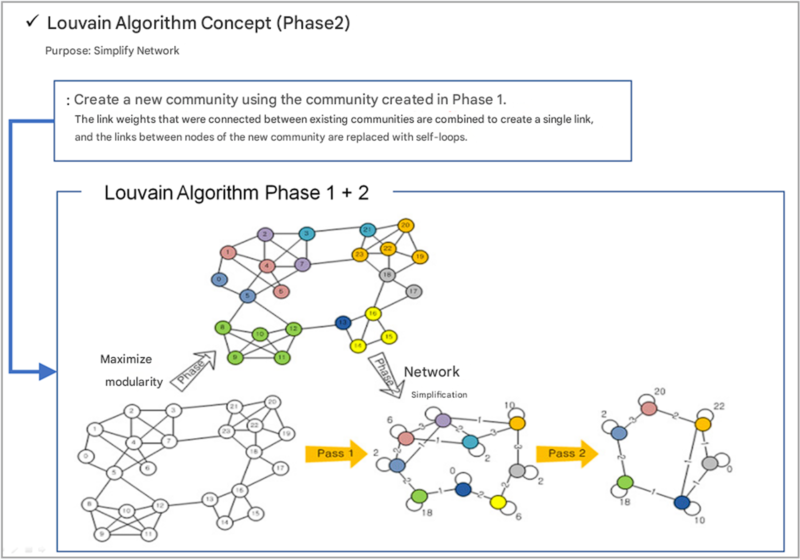
The purpose of Phase 2 is to simplify the network by maximizing modularity in Phase 1. The link weights that were connected between existing communities are merged into a single link, and the links between nodes in new communities are replaced with self-loops to simplify the network.
4. Results
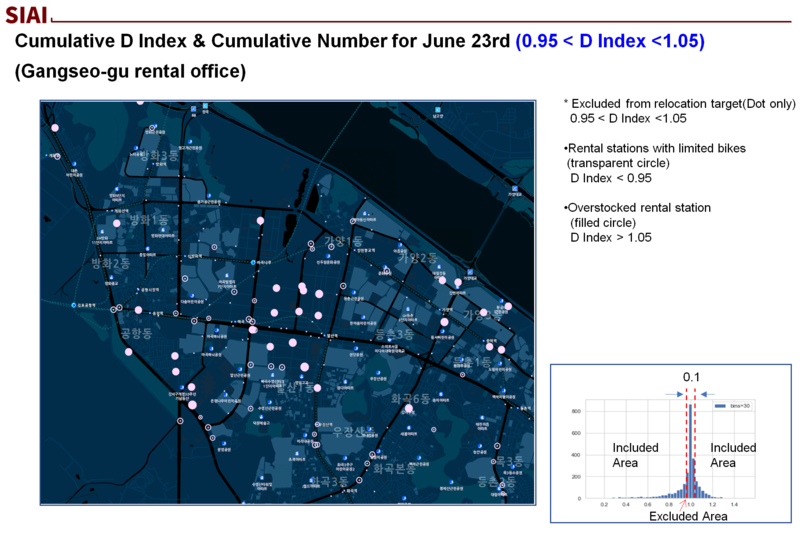
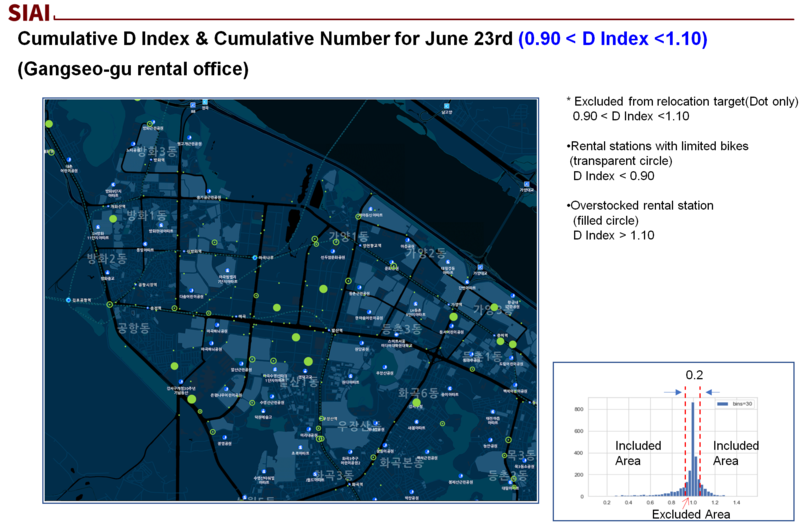
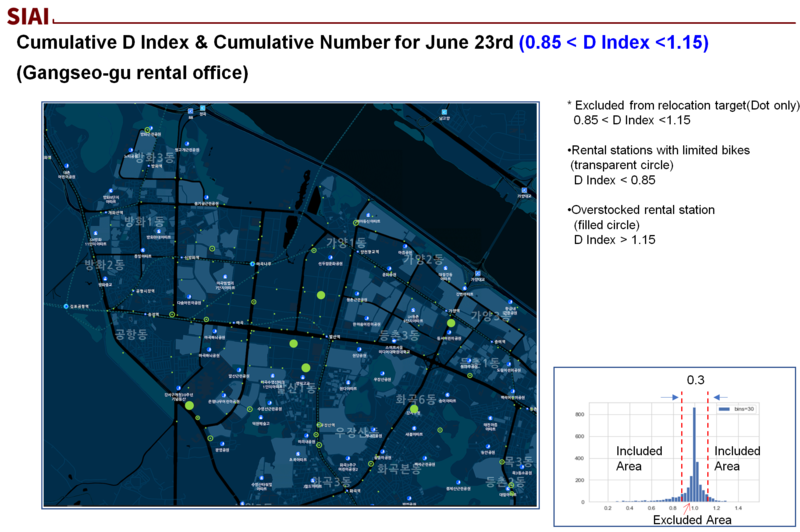
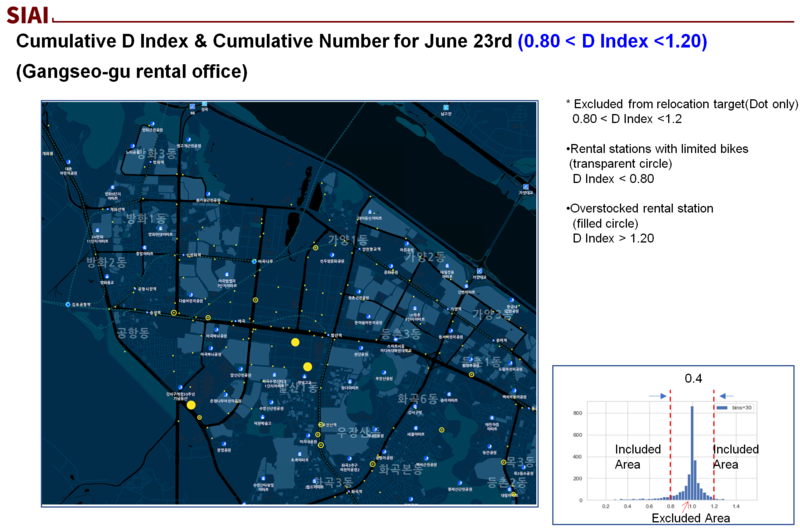
4.1. Cumulative number of Seoul Bike rentals in Gangseo-gu according to D Index
The picture you see is a picture showing the cumulative number of Seoul Bike bicycles in Gangseo-gu by rental station location in June 2023, with a D Index of 0.95 to 1.05 and a range of 0.1.
Transparent circles are negative cumulative amounts, indicating places with a large number of rentals, and filled circles are places with a large number of returns. Also, the places with dots are rental stations excluded from the reallocation target.
Currently, only rental stations within the range of 0.1 are excluded, so there are many target rental stations, and the cost is higher than other cases with a large range. (Low reallocation efficiency)
When the range is as wide as 0.4, this is the case where there are the most rental stations excluded from relocation, and in this case, there are the fewest rental stations subject to relocation, so the cost of relocating Seoul Bike is greatly reduced, making it an efficient section.
4.2. Cumulative number of Seoul Bike rentals in Seoul according to D Index
The picture you see is a picture showing the cumulative number of Seoul bikes by rental station location in Seoul as of June 2023. The D index is 0.95~1.05, and the range is 0.1.
Transparent circles indicate places with a large number of rentals with negative cumulative numbers, and filled circles indicate places with a large number of returns. Also, the places with dots are rental stations excluded from the redistribution target.
Currently, only rental stations within the 0.1 range are excluded, so the cost is higher than other cases with many target rental stations and a large range. (Low redistribution efficiency)
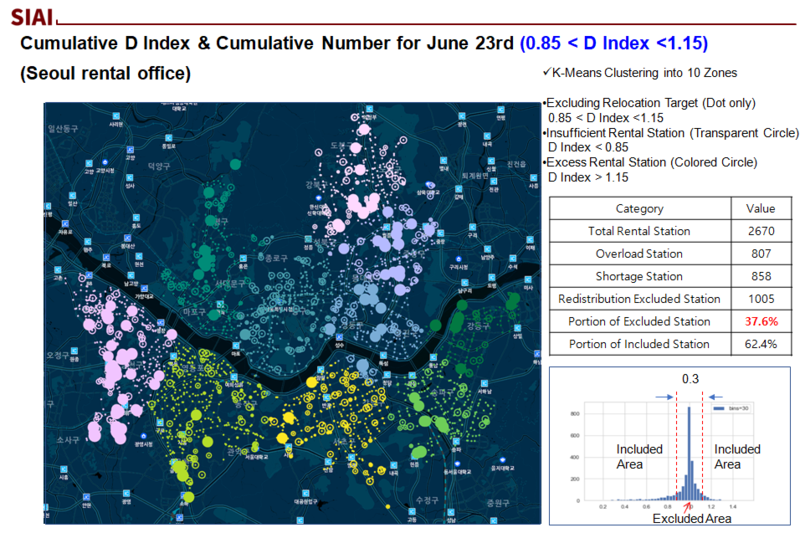

In the case where the Index Range for the Rental Stations Excluding Relocation Targets is 0.4, the ratio of rental stations excluded from the relocation target for Seoul Bike is 66.6\%, and the ratio of rental stations subject to relocation is low at 33.4\%.
In this case, the cost of Seoul Bike relocation will be greatly reduced, and the relocation efficiency can also be the highest.
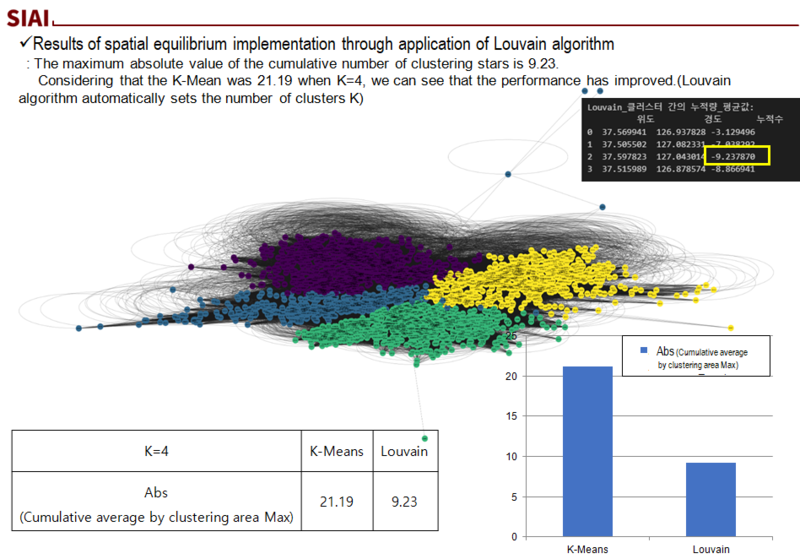
4.3. Results of spatial equilibrium implementation through application of Louvain algorithm
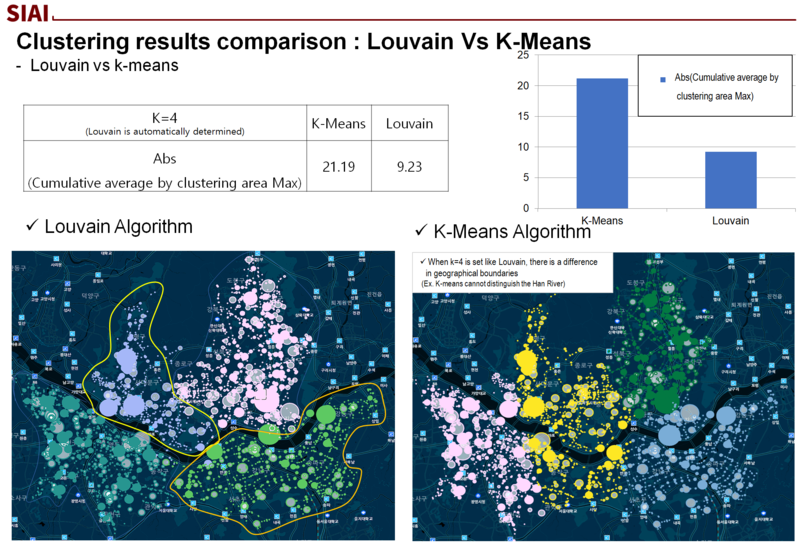
As explained in the idea above, the result of setting up Node and Edge using the rental and return data of Seoul Bike and applying the Louvain algorithm showed much better results than K-Means, which simply used the Euclidean coordinates of the rental station location.
When clustering, the cumulative average by region was used as an indicator of performance, and the closer it is to 0, the closer it is to the partial sum, which means that the bicycle is likely to move only within the clustering region.
K-Means is 21.19, while Louvain is 9.23. We were able to confirm that the cumulative average by region was reduced by almost half.
Louvain algorithm
And the K-Means algorithm shows clustering that ignores the Han River, while the Louvain algorithm clustering seems to reflect the geographical characteristics of Seoul better.
The results below are the results of the Seoul Bike clustering classified by the K-Means and Louvain algorithms, colored on the map of Seoul.
While K-Means shows results that cannot distinguish the Han River, the Louvain algorithm shows the boundary of the Han River much more clearly.
References
1. F. Chiariotti, C. Pielli, A. Zanella and M. Zorzi, "A dynamic approach to rebalancing bike-sharing systems", Sensors
2. M. Dell’Amico, E. Hadjicostantinou, M. Iori and S. Novellani, "The bike sharing rebalancing problem: Mathematical formulations and benchmark instances"
3. P. Yi, F. Huang and J. Peng, "A rebalancing strategy for the imbalance problem in bike-sharing systems"
4. C. M. de Chardon, G. Caruso and I. Thomas, "Bike-share rebalancing strategies patterns and purpose"
5. C. Zhang, L. Zhang, Y. Liu and X. Yang, "Short-term prediction of bike-sharing usage considering public transport: A lstm approach"
6. S. Ruffieux, N. Spycher, E. Mugellini and O. A. Khaled, "Real-time usage forecasting for bike-sharing systems: A study on random forest and convolutional neural network applicability"