Is Bubble in Auction Market Really Bubble? Bubble Index in Real Estate Auction Market
Hyeyoung Park*
* Swiss Institute of Artificial Intelligence, Chaltenbodenstrasse 26, 8834 Schindellegi, Schwyz, Switzerland
Abstract
In this study, we address the phenomenon of financial bubbles, where asset or commodity prices deviate significantly from their intrinsic value or market consensus. Typically, bubbles go unnoticed until they burst, causing abrupt price declines. Given the global interconnectedness of markets, such bubbles can have profound economic repercussions, emphasizing the importance of proactive detection and management. Our approach focuses on predicting bubbles in auction markets, driven by crowd psychology or the ‘herd effect.’ We posit that these bubbles manifest as a ‘winner’s curse’ in auctions, and that if investors flock to the auction, the difference between the first and second place prices will be frequently large. While prior research in real estate and auction markets has relied on hedonic pricing models, our study distinguishes itself by employing mathematical statistical modeling alongside a hedonic pricing framework. Specifically, we employ logistic regression, with corrected winning bid rates as the dependent variable and various auction-related factors as independent variables, excluding intrinsic property value. We also employ a Chow-test to assess structural changes within the market over time, examining whether the Bubble Index, a novel metric indicating the intensity of auction competition, has varying effects on distinct market subgroups. Moreover, unlike previous studies, we statistically validate the existence of bubbles in auction markets through the development of a Bubble Index. Our results reveal that the explanatory power of this index significantly increases post-structural shock, with a maximum impact of 5.65% on the winning bid rate
1. Introduction
1.1 Background and Objectives
Bubbles in financial assets or commodities, characterized by prices exceeding intrinsic value, have historically posed risks to markets and economies[8]. Often, these bubbles go unrecognized until they burst, resulting in significant investor losses. This phenomenon, fueled by “herd psychology” and amplified by modern communication channels like social media, necessitates proactive detection and management.
This study investigates potential market overheating in the Gangnam-gu apartment real estate auction market from 2014 to 2022, focusing on identifying bubbles and overheating. Unlike previous studies predicting the winning rate, we study the existence and overheating of bubbles based on the idea that price competition in the auction market will intensify when a bubble occurs due to the nature of auction competition. We introduce a “bubble index” to statistically validate bubble existence and assess its differential impact on subgroups when market structural shocks occur, which is an index of when competition in an auction becomes overheated and the difference between the first and second place prices becomes large. This study involves checking whether the explanatory power of the bubble index after a structural shock is significantly higher than before that point.
1.2 Features of the Korean Real Estate Auction System and Bubbles
Korea’s real estate auction system, a sealed-bid process with participants’ prices undisclosed, promotes individual independence[1]. In addition, it employs first-price auctions, where the highest bid determines the winning price, influenced by price competitiveness and return on investment.
In overheated markets, increased liquidity and rising prices may elevate expected returns, potentially leading to irrational market conditions. External shocks can disrupt individual independence, fostering a Winner’s Curse scenario[2][3], where the winning bidder pays more than the objective value, characterizing an overheated market. A noteworthy behavior is a frequent large gap between the first and second-place prices, akin to bubble dynamics, reflecting intense competition.
In general, it is rational for bidders to place bids that are lower than the asking price and higher than their competitors, and it is unusual for bidders to place bids that are overwhelmingly larger than their competitors. Therefore, if a large gap between the first and second place prices is a frequent occurrence in an auction market, we can assume that there are many confident investors. This is similar to the behavior of a bubble, where competition drives prices up due to aggressive investment by new investors entering the market.
This “bubble index” uses the first-to-second-place price difference and integrates it into a regression model as an independent variable. Additionally, we account for the time difference between appraisal and winning bids by calibrating appraised prices to market values at the auction time.
2. Review of Prior Research
Previous studies in real estate auctions have predominantly focused on factors influencing the winning bid price, utilizing either the hedonic pricing model[5] or time series data analysis.
- Lee, H.K, Bang, S.H and Lee, Y.M (2009)[9]:
Employed a hedonic pricing model to estimate winning bid prices for apartment auctions. Noted that during rising apartment prices, the time-calibrated winning bid rate exceeded the original rate, with the opposite occurring during declines.
- Lee, J.W and Bang, D.W (2015)[10]:
Analyzed housing characteristics, auction specifics, and macroeconomic variables’ impact on the winning bid rate via a hedonic model. Significant influencers included the number of bidders, the number of failed bids, and market interest rates, with varying effects in upswing and downswing periods.
- Jeon, H.J (2013)[4]:
Utilized a VECM model to examine the time series pre and post-global financial crisis. Observed the disappearance of house price appreciation expectations post-crisis, leading to an increase in the number of items in the auction market and a decrease in the winning bid rate.
Despite these insights, the use of the hedonic pricing model carries limitations:
- Limitation 1: Multicollinearity Concerns
Due to indiscriminate variable addition, multicollinearity issues may arise. The model’s explanatory power diminishes, leading to unreliable results when excessive variables are included without due consideration.
- Limitation 2: Intrinsic Value Ambiguity
Determining the intrinsic value of a property is challenging due to numerous influencing factors such as school zones, job prospects, infrastructure, and urban planning.
- Limitation 3: Assuming a homogeneous market over the entire period
Furthermore, prior studies often categorized periods as rising, falling, or freezing without considering structural market changes.
Since the mid-2010s, the hedonic model has seen limited use in predicting auction prices due to these limitations.
This study seeks to address these limitations as follows:
- Constructing a model with judiciously selected variables and appropriate controls.
- Mitigating intrinsic value complexity by using the winning bid rate, not price, as the dependent variable and employing a logit model.
- Employing a Chow-test to segregate datasets, uniquely focusing on bubble phenomena stemming from irrational investment sentiment in overheated markets to reveal structural shifts.
3. Research Area Selection and Data Pre-processing
3.1 Comparison of Auction Cases in 25 Seoul Wards and Area Selection
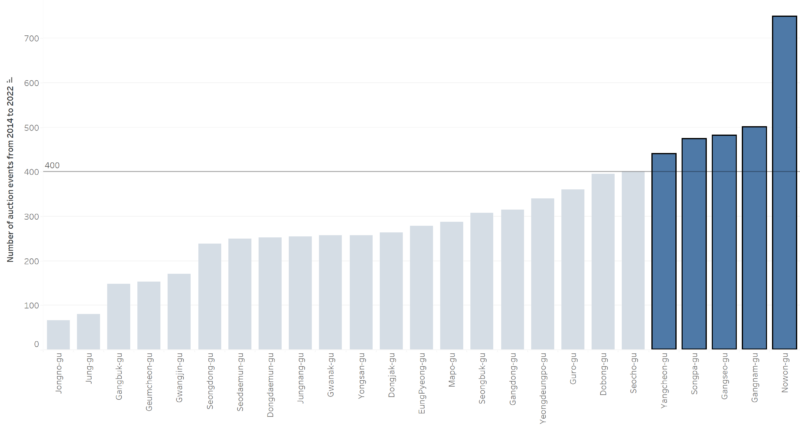
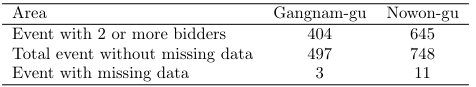
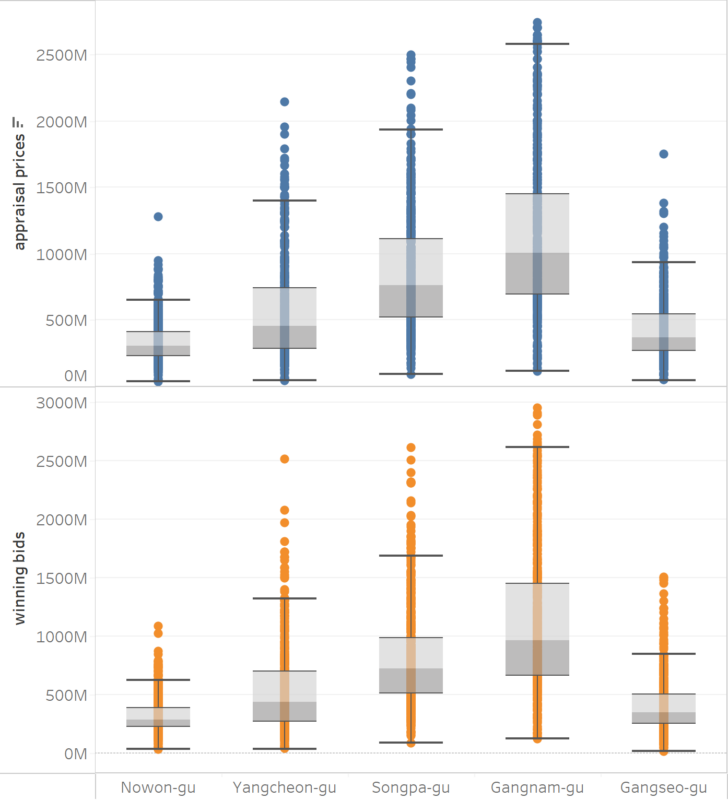
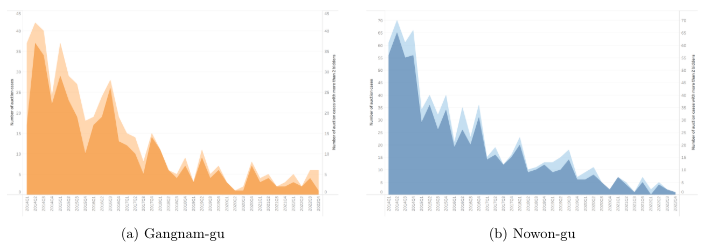
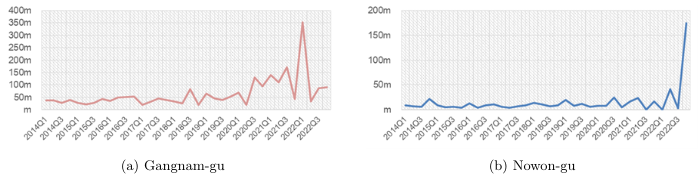
To ensure an adequate dataset, we examined appraisal prices and winning bids distributions in five of Seoul’s 25 wards from January 2014 to December 2022: Yangcheon-gu, Gangseo-gu, Songpa-gu, Gangnam-gu, and Nowon-gu, known for high apartment transaction volumes(Figure 1). Excluding urban living houses (one-room units with a floor area of 85 square meters or less), deemed dissimilar to the apartment market, left us with Nowon-gu and Gangnam-gu as the primary areas of focus due to their significant auction event numbers. Nowon-gu and Gangnam-gu had the highest number of auction events, but there were significant differences in the price distribution(Figure 2). After assessing auction event data and the bubble index, we opted to focus our analysis on Gangnam-gu, where no data gaps exist.
3.2 Bubble Index using the Price Difference
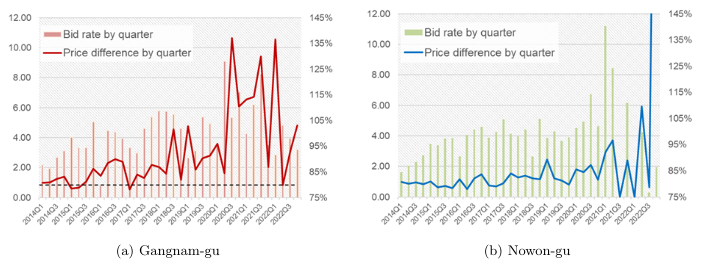
To identify potential bubbles, we considered the frequency of large price differences between first and second place bids in auction markets. Our goal was to create a bubble index based on these differences. We aggregated price differences from auctions with more than two bidders (excluding solo bids) and calculated quarterly averages to minimize missing data.
To capture changes effectively, we employed the geometric mean of quarterly price differences, instead of the arithmetic mean, due to the baseline. This method revealed notable increases compared to the baseline year (2014). Notably, Nowon-gu had no auction events in Q4 2021 and Q1 2022, leading to missing data. We opted not to use the difference between first and third place bids due to more frequent missing values and data collection challenges.
3.3 Time Correction of Winning Bid Rate
In the auction system, a time gap exists between building appraisal and the actual winning bid \(\frac{B_i}{A_i}\). This discrepancy affects the winning bid rate, which should reflect surcharges or discounts relative to market prices accurately[9]. To rectify this, we corrected the appraised price using the KB market price. The resulting corrected winning bid rate \(\frac{B_i}{A’_i}\), calculated by dividing the winning bid by the adjusted appraised price, serves as our dependent variable.
\[ A’_i = \frac{A_i \cdot S_p}{S_{p-t}} \]
\(A’_i\) represents the adjusted appraised value, where \(A_i\) is the original appraised value, \(S_p\) is the KB market price at the time of winning the bid, and \(S_{p-t}\) represents the KB market price at the time of appraisal.
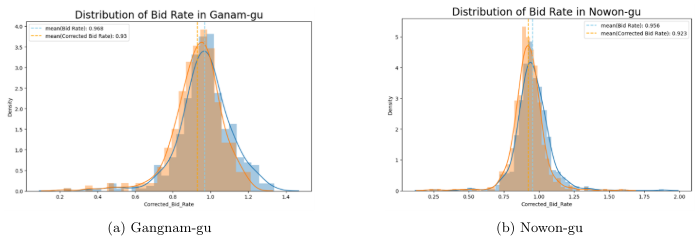
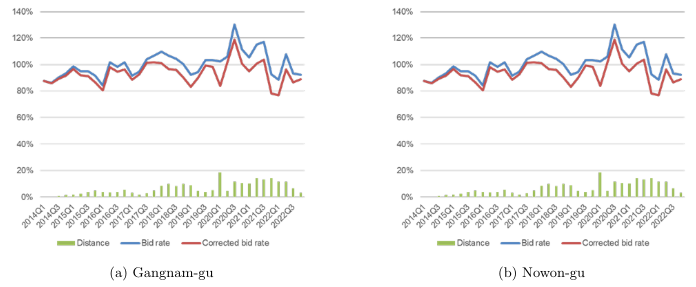
When comparing the distribution of winning bid rate and corrected winning bid rate(Figure 6), it’s evident that the average corrected winning price is lower both in Gangnam-gu (from 96.8% to 93.0%) and Nowon-gu (from 95.6% to 92.3%). This observation underscores the significant impact of the time gap between appraisal and auction. Typically, during this time difference, market prices, reflecting buying and selling dynamics, tend to rise.
Analyzing the average winning bid rate and the corrected winning bid rate by quarter reveals an interesting trend(Figure 7). In Gangnam-gu, the gap between these rates began widening after a specific point (Q1 2016), indicating increased price fluctuations in the buying and selling market. Since Q1 2018, this gap has continued to grow. The fact that the corrected winning bid rate is consistently lower than the winning bid rate in recent years suggests that price increases are occurring in the buyer’s market, aligning with the decrease in the number of auctions as the buyer’s market becomes more active.
In Nowon-gu, the winning price ratio slightly exceeds the corrected winning price ratio for all time periods, implying that market prices and winning prices in Nowon-gu are relatively similar, despite the steady increase in market prices.
3.4 Adjustment of Bubble Index Considering Time Series Analysis
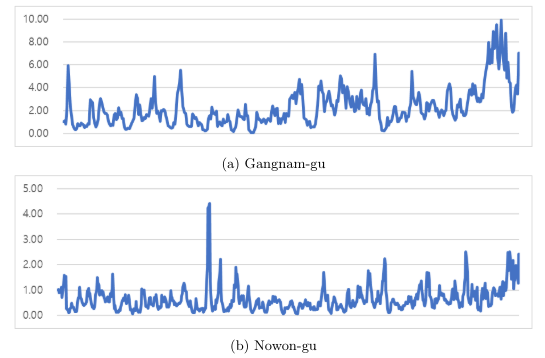
To identify structural changes attributed to a bubble, which signifies an overheated market, the data must be presented in a continuous time series format. A Chow-test serves as a valuable tool for comparing coefficients from two linear regressions on before-and-after datasets in time series data, detecting structural shocks or changes. Essentially, the Chow-test assesses if the impact of the independent variable (the bubble index) on the dependent variable varies before and after a specific point. Therefore, we transform the quarterly bubble index into time series data by adjusting it to a geometric mean of \(k\) consecutive observations(Figure 8).
\[I_j = \prod_{i=j-k+1}^k \left(\frac{P_i^t}{P^0}\right)^{\frac{1}{k}}\]
\[P^0 = \prod_{i=1}^k (D_i)^{1/k}\]
\[P_i^t = \prod_{i=j-k+1}^j (D_i)^{1/k}\]
In this equation, \(j\) represents the index for the winning bid order (e.g., 1, 2, …), \(k\) represents the size of the dataset, \(P_i^t\) represents the geometric mean of price differences at time \(t\) over a dataset of size \(k\), \(P^0\) represents the geometric mean of price differences at a reference time point over a dataset of size \(k\), and \(D_i\) represents the difference between the winning bid price (1st place) and the second-place bid price for a specific event.
4. Analytical Model Setup
Historically, many studies predicting real estate prices have employed the hedonic pricing model, which incorporates numerous property-specific variables. However, this approach has faced limitations such as multicollinearity, intrinsic value ambiguity, and market homogeneity assumptions.
Our study seeks to overcome these limitations by utilizing a hedonic pricing model, specifically regression analysis, coupled with mathematical statistical modeling to detect real estate bubbles. In this model, logistic regression excludes intrinsic property value as the dependent variable, using the corrected winning bid rate instead. Independent variables include the number of auctions, number of bidders, the difference between the first and second prices (bubble index), and M2 currency volume.
We employ the Chow-test to segregate data sets, assuming structural market changes over the entire period. In the event of a structural market shock, like a bubble, we examine whether the independent variable (the bubble index) exhibits different effects on subgroups.
4.1 Equation Construction
The traditional hedonic model, explaining prices as the sum of intrinsic values, may not be suitable for bubble detection, as bubbles often occur when intrinsic values are challenging to measure. To eliminate intrinsic value, we utilize the winning bid rate in a regression on logarithmic dependent and independent variables. The model takes the form:
\[ \log\left(\frac{B_i}{A_i}\right) = v_i + \sum_{n=1}^N \beta_n \log(X_{in}) \]
Here, \(A_i\) represents the appraised value, reflecting market prices, including intrinsic property value. \(B_i\) is the winning bid, encompassing intrinsic value, bidder risk, and bubble-induced competition. Taking the natural logarithm of both prices eliminates intrinsic property value from the equation. The error term \(v_i\) is minimal due to the high sales and transaction volume for apartments like the ones analyzed in this study. \(X_in\) represents independent variables explaining the winning bid rate, such as risk factors and auction event bubbles.
Due to the time gap between appraisal and winning bids, we use a time-corrected appraised value defined in Part 3-4 as the equation:
\[ \log\left(\frac{B_i}{{A’}_i}\right) = \alpha_i + \sum_{n=1}^N \beta_n \log(X_{in}) \]
Where, \(\frac{B_i}{{A’}_i}\) is the time-corrected winning bid rate, \(\alpha_i\) is a constant resulting from time correction with error term and \(X_{in}\) represents \(N\) independent variables of specific auction event \(i\).
4.2 Variable Characteristics
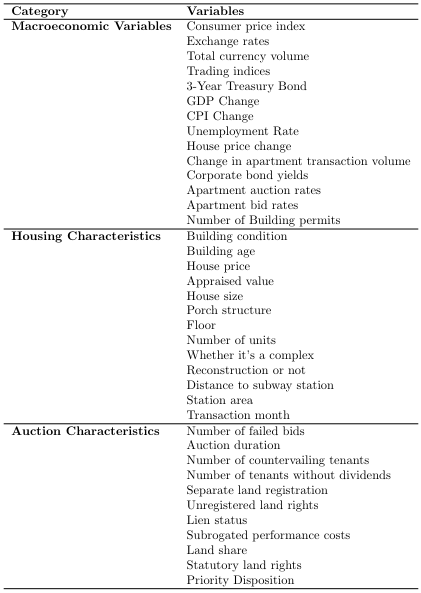
The variables employed in prior studies can be broadly categorized into macroeconomic variables, housing characteristics, and auction characteristics. Notably, variables pertaining to the intrinsic value of real estate have been excluded through the logit model outlined in Equation 4-1. In this study, we have opted to utilize the following independent variables: the bubble index, number of bidders, number of failed auctions, and M2 currency volume.
The “Index 5” variable, which we refer to as the bubble index, was defined in Part 3-4 following a meticulous selection process that considered time series analysis.
While the bubble index scrutinizes bubbles within the auction market, the number of bidders serves as a key indicator to gauge the extent of competitive overheating during individual events. This variable has been widely employed in several studies and is limited to events featuring two or more bidders[6][7].
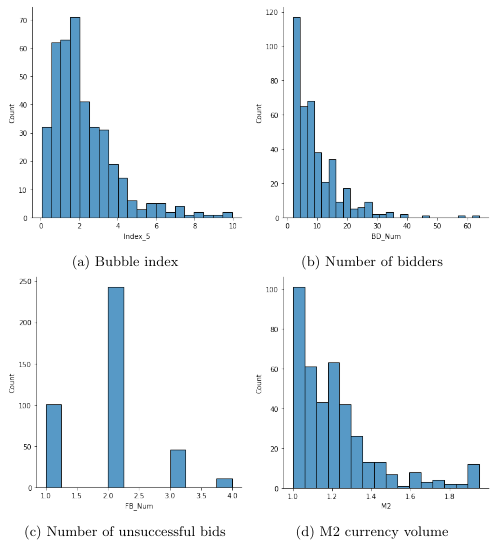
Previous studies have delved into risk factors associated with auction events, often segmenting them into various variables. Among these, the number of unsuccessful bids has emerged as one of the most influential variables, serving as an instrumental indicator. Regarding the number of bids, we apply a logit model and categorize the data as follows: 1 for new events with no failures, 2 for events with one failure, 3 for events with two failures, and 4 for events featuring three or more failed bids.
Aligned with the notion that bubbles tend to emerge when accurate price estimation becomes challenging, we incorporate the M2 currency volume as an indicator. This variable takes into account market liquidity and is applied using the initial analysis period of January 2014 as a baseline (set to 1).
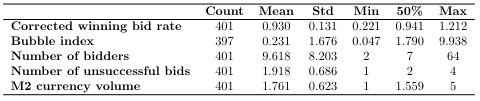
The characteristics of the variables utilized in the hedonic model of this study are summarized in the table below(Table 3).
4.3 Chow-Test for Structural Changes
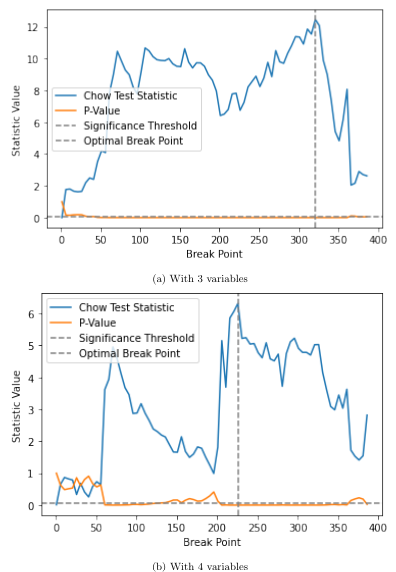
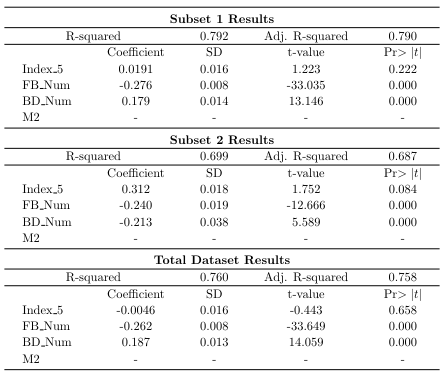
The Chow-test is a statistical tool for detecting structural breaks in time series data by comparing coefficients from two linear regressions on before-and-after data sets. In our analysis of Gangnam-gu auction data, we employed a calibrated regression model of the winning bid rate, including the bubble index, number of bidders, and number of winning bids.
The Chow-test results revealed a structural break at point 321 (Q1 2018), indicating a significant change in the regression coefficients(Figure 10). A subsequent analysis, adding M2 currency volume as an independent variable, identified a break at point 226 (Q2 2016).
5. Analysis Results
5.1 Regression Model
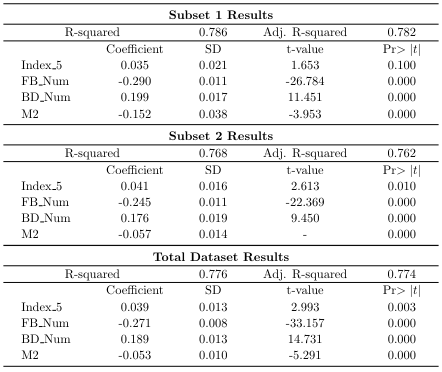
The Ordinary Least Squares (OLS) analysis of the calibrated winning bid rate regression model, utilizing three variables: the bubble index, number of bidders, and number of wins, is presented below. The dataset preceding the break point is referred to as “Subset 1,” while the dataset succeeding the break point is termed “Subset 2.” We also provide the effective coefficients and standard deviation results for the entire dataset(Table 4).
The relatively low R-squared value of the model and the less significant t-test statistics associated with the bubble index can be attributed to the potential presence of omitted variables. To address this concern, we introduced M2 currency volume as an additional variable and examined the results of the regression model equation with four variables.
As a result, the R-squared value demonstrated improvement compared to the three-variable regression model, and notably, the estimated coefficient of the bubble index achieved statistical significance(Table 5). Additionally, the effective coefficients for the number of auctions and number of bidders variables showed increases, revealing a negative correlation between the number of auctions and M2, and a positive correlation between the number of bidders and M2. This suggests that over time, an increase in M2 corresponds to rising real estate prices, a phenomenon reflected in the model through the differential between the winning bid rate and the corrected winning bid rate.
The residual plot further verifies the resolution of the omitted variable issue, taking the form of a random cloud.
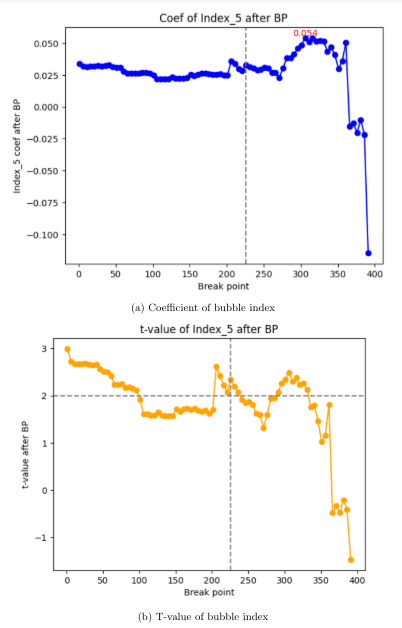
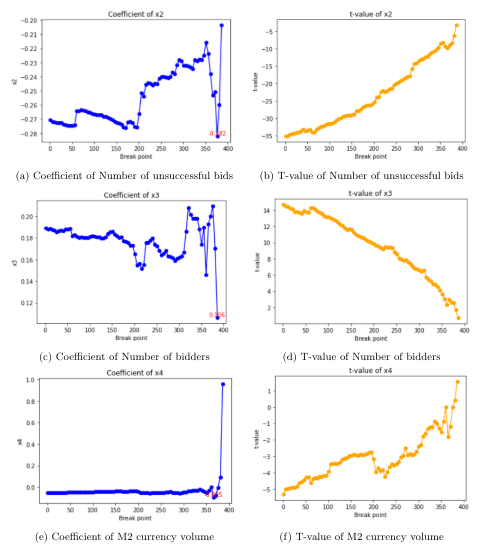
We observed that the influence of the bubble index intensified just before break point 226 and reached its maximum impact at break point 306 (Q4 2017). At this time, a 1-point increase in the Bubble Index raised the corrected winning bid rate by 5.12% in average.
5.2 Bubble Index
The Bubble Index, reflecting the intensity of price differences between the first and second bidders, operates during periods of real estate price appreciation. It provides insights into the cycle and size of real estate bubbles, acting as an indicator of investors’ expectations.
5.3 Other Variables
The effect of the number of unsuccessful bids on the winning bid rate diminished significantly after point 306, indicating that winning bids had less impact on the winning rate as the bubble deepened.
The increase in the number of bidders positively correlated with the Bubble Index, aligning with the “winner’s curse” phenomenon. M2 currency volume did not significantly impact the winning bid rate but served as a control variable.
5.4 Bubble Index Over Time
The Bubble Index analysis for data with more than two bidders revealed fluctuations in the degree of overheating in auction markets. Notably, overheating increased over time, with the ratio between the first and second bidders’ prices reaching peak values in recent years.
The data set was divided using the Chow test, and the analysis indicated that the Bubble Index operated differently in the sub-data sets before and after the break point (Q2 2016).
5.5 Implications
The Bubble Index, derived from the price difference between the first and second place bids, effectively explains auction market overheating. Its sustained high values suggest ongoing overheating, with the average Bubble Index remaining elevated since Q3 2020. This index can serve as an early warning indicator for investors before the bubble deepens.
In conclusion, our analysis indicates that the Bubble Index reflects market expectations and effectively detects real estate market overheating. However, it’s important to note that the index may become distorted at the peak of a bubble when fewer auction events occur.
6. Conclusion
In this comprehensive study, we meticulously examined the presence and magnitude of bubbles within the auction market through a systematic approach. To begin, we devised a bubble index, tailored to instances featuring more than two bidders, which served as an essential metric for gauging the escalation in price disparities between the top two bidders over time.
Subsequently, employing the Chow test—an analytical technique comparing the regression coefficients of two distinct phases in time series data—we partitioned the dataset. This division unveiled varying behaviors in the effective coefficient and t-statistic values associated with our bubble index across these distinct segments.
Notably, the segmentation pinpointed a crucial turning point in the second quarter of 2016, where the t-test value for the bubble index transformed from being inconclusive to significant. Furthermore, within the later dataset, the bubble index exhibited a substantial effective coefficient of 0.055, indicating a noteworthy 5.65% influence on the winning bid rate. Meanwhile, the t-test outcomes for the other variables remained consistently valid throughout both datasets.
This investigation yielded a multifaceted picture: before the bifurcation point, the model displayed a coefficient of determination (R-squared) of 77.6%, along with an Adjusted R-squared of 77.4%, signifying its robust explanatory power. Following the division, the model maintained considerable explanatory capacity, with an R-squared of 76.8% and an Adjusted R-squared of 76.2%. Moreover, it became evident that competition intensified, as witnessed by the average corrected winning bid rate increasing from 91% to 96% post-bifurcation.
Our utilization of the Bubble Index proved invaluable. It highlighted not only transient spikes but also persistent hotspots as key indicators of market overheating. Since the third quarter of 2020, the average Bubble Index for each auction order has consistently held at 6.04, underscoring a prolonged state of overheating in the auction market.
In conclusion, this study underscores the utility of the Bubble Index, founded on the price disparity between first and second place bids, as an effective metric for elucidating overheating tendencies in the auction market—an insight reflective of investor sentiment. Nevertheless, it’s important to acknowledge that the Bubble Index may become distorted at the peak of a bubble due to dwindling auction events. Despite this limitation, it holds promise as a preventive tool to alert investors before the escalation of a market bubble.
References
[1] Allen, and Marcus, T. Discounts in real estate auction prices: Evidence from south florida.
Journal of Real Estate Research 25, 3 (2001), 38—-43.
[2] Bazerman, Max, H., and William, F., S. I won the auction but don’t want the prize. Journal
of Conflict Resolution 27, 4 (1983), 618––634.
[3] Capen, Edward, C., Robert, V., C., and William, M., C. Competitive bidding in high-risk
situations. Journal of Petroleum Technology 23 (1971), 641—-653.
[4] Jeon, H. An empirical study on the correlation between the housing sales market and auction
market -focused on before and after the global financial crisis. Korea Real Estate Review 23, 2
(2013), 117–132.
[5] Jin, N., Lee, Y., and Min, T. Is the selling price discounted at the real estate auction market?
Housing Studies Review 18, 3 (2010), 93–117.
[6] Kagel, John, H., and Dan, L. The winner’s curse and public information in common value
auctions. The American Economic Review 76, 5 (1986), 894—-920.
[7] Kagel, John, H., and Dan, L. Common value auctions and the winner’s curse. NJ: Princeton
University Press.
[8] Karl, E., C., and Robert, J., S. Is there a bubble in the housing market? In Brookings
Papers on Economic Activity (2003), vol. 2, The Johns Hopkins University Press, pp. 299–342.
[9] Lee, H., Bang, S., and Lee, Y. True auction price ratio for condominium: The case of gangnam
area, seoul, korea. Housing Studies Review 17, 4 (2009), 233–258.
[10] Lee, J., and Bang, D. Factors influencing auction price ratio: Auction characteristics, macroeconomic variables. Korea Real Estate Review 25, 2 (2015), 71–84.