Sungsu Han (MBA, 2024)
This article explores Seoul’s public bicycle rental system, Ddareungyi, examining its popularity, challenges, and economic viability. To enhance clarity, the discussion is divided into four sections.
Part 1 introduces a personal journey into cycling, which sparks a deeper curiosity about the Ddareungyi bike-sharing system in the Magok Business District. Next, Part 2 examines the challenges public bicycle programs face, particularly the high costs of redistributing bikes, and explores how demand forecasting can optimize this process.
Part 3 introduces innovative clustering techniques aimed at improving spatial balance in bike distribution, with a focus on network community detection to boost efficiency. Finally, Part 4 envisions the Ddareungyi system as a closed cycle, similar to the water cycle, demonstrating how understanding this model can enhance the management of bike shortages and redistribution efforts, offering insights applicable to other shared resource systems.
What Sparked My Interest
I am in my early 40s and work at an office near Magok Naru Station and I live near Haengsin Station in Goyang City. I used to commute by company shuttle, but recently I’ve taken up cycling as a hobby and now commute by bike. The biggest reason I got into cycling was because of the positive image I had of Seoul’s public bicycle program, Ddareungyi.
One day, I stepped off the shuttle, rubbing my sleepy eyes, and was surprised to see hundreds of green bikes clustered together. I hadn’t noticed them before, probably because I’m usually too tired as an office worker, not paying much attention to my surroundings once I get to work. Or maybe it’s just because I’m so groggy in the mornings that the bikes slipped past me. Either way, the sight took me by surprise.
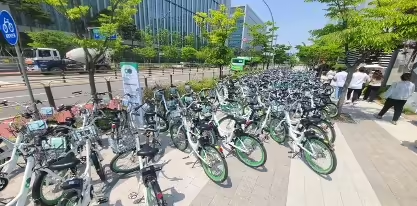
Most crowded areas
I often wondered where the many Seoul bikes at the Magok intersection came from. This also sparked my interest in Ddareungi and made me think about researching public bike programs as a topic for my thesis.
As I continued to develop my thoughts, I suddenly wondered, “Is there really a place that uses bicycles more than Magok?” A quick internet search provided the answer. According to the “2022 Traffic Usage Statistics Report” published by the Seoul Metropolitan Government, the district with the highest use of public bicycles (Ddareungi) in Seoul was Gangseo-gu, with 16,871 cases.
Furthermore, according to data released on the Seoul Open Data Platform, the top seven public bicycle rental stations in Gangseo-gu are as follows: ▲ Magoknaru Station Exit 2 with 88,001 cases ▲ Balsan Station near Exits 1 and 9 with 63,166 cases ▲ Behind Magoknaru Station Exit 5 with 59,095 cases ▲ Gayang Station Exit 8 with 56,627 cases ▲ Magok Station Intersection with 56,117 cases ▲ Magoknaru Station Exit 3 with 52,167 cases ▲ Behind Balsan Station Exit 6 with 48,145 cases, etc. I was quite surprised to learn this. The place with the highest use of Ddareungi in Seoul was right here, the Magok Business District, where I commute to work.
During my daily commute, I began to notice more people using bicycles than I had originally thought. Bikes are increasingly viewed as a way to address environmental concerns while also promoting fitness for office workers. Inspired by this trend, I considered commuting by bike myself, like many others in Seoul. However, since I live in a different district, I faced the dilemma of choosing between Goyang City’s Fifteen program or Seoul’s Ddareungi. During my research, however, I discovered that Goyang City’s Fifteen program had been discontinued due to financial losses.
Reasons for Deficits in Public Bicycle Programs
So, I looked into the deficit sizes of other public bicycle programs and found that “Nubija” in Changwon had a deficit of 4.5 billion KRW, “Tashu” in Daejeon had 3.6 billion KRW, and “Tarangke” in Gwangju had a deficit of 1 billion KRW. This showed that most regional public bicycle programs are struggling with deficits. Even Seoul’s public bicycle program, “Ddareungi”, which I thought was doing well, has a deficit of over 10.3 billion KRW. This made me wonder why public bicycle programs are always in deficit.
At the same time, although Ddareungi is a beloved mode of transportation for the ten million citizens of Seoul, I started to worry whether this program could be sustained in the long run. After looking into the issue, I discovered that the biggest contributor to the deficits in public bicycle programs is the high cost of redistributing the bikes across the city.
For Goyang City, it was estimated that out of a total maintenance budget of 1.778 billion KRW, around 375 million KRW is spent on on-site distribution, and 150 million KRW is used for vehicle operation costs related to redistribution. This means approximately 30% of the total budget goes towards redistribution, making it the largest single expenditure. A similar trend is observed in Changwon City, where redistribution costs also account for a significant portion of the budget. Although this information is not directly about Ddareungi, it suggests that about 30% of the total operating costs of public bicycle programs are likely spent on bicycle redistribution.
This led me to believe that cutting bicycle redistribution costs could be the key to resolving the chronic deficits in public bicycle rental programs. It also made me consider that optimizing redistribution by analyzing Ddareungi users’ usage patterns could help reduce these expenses. To achieve this, I needed to analyze the factors influencing rental volume and create a model to predict expected demand, which would help prevent shortages and minimize unnecessary redistribution efforts.
Optimizing Redistribution Through Demand Forecasting
The Ddareungi bike rental data includes bike ID, return time, and station information. To visualize rental volumes by station, additional location data (latitude and longitude) from the Seoul Open Data Plaza was used. Synoptic weather data from the Seoul Meteorological Station was also integrated with the rental records to analyze the impact of weather on bike usage. A detailed analysis of usage patterns was conducted on a four-year dataset (2019-2023) from the Ddareungi station at Exit 5 of Magoknaru Station.
General Usage Patterns
The result showed that bike usage drops with stronger winds and rain but peaks at moderate temperatures (15-17°C). The highest usage occurs during weekday morning and evening commutes. Usage patterns are concentrated in business districts such as Magok, G-Valley, and Yeouido, where most users are in their 20s and 30s. These areas experience imbalances in rentals and returns, especially during commutes.
The general usage patterns were analyzed to forecast bicycle demand and supply. Using the STL (Seasonal and Trend decomposition using Loess) method, rental and return volumes were first decomposed to reveal seasonality, trends, and cycles. The residuals from this decomposition were then applied to a SARIMAX model, incorporating weather and time variables to explain the usage patterns. The model successfully forecasted demand, achieving an R² of 0.73 for returns and 0.65 for rentals.
Optimization Based on the Rental-Return Index Range
To optimize bike redistribution, the “Rental-Return Index” was introduced to measure the difference between expected rentals and returns at each station.
\[ 1 \ Day \ Index = \frac{Estimated \ Rental \ Volume}{Estimated \ Return \ Volume} \]
As shown in the equation above, when a station has the right balance, with neither a surplus nor a shortage of bikes, the Index equals 1. An Index greater than 1 indicates a shortage, while an Index below 1 signifies a surplus. By categorizing stations into surplus or deficit, redistribution efforts can be directed toward stations with shortages (Index greater than 1), improving customer satisfaction.
In addition, this approach is particularly useful because the number of redistribution targets can be quantified based on the available budget for Seoul’s bike system. Stations with the highest Index values are prioritized first, and the top stations for redistribution are selected according to the allocated budget, ensuring cost-effective and efficient redistribution efforts.
To further optimize bike redistribution, clustering can be applied to group business and residential areas based on rental and return distributions within districts, aiming for a rental-return Index of 1. This method would minimize the distance bikes need to be moved during redistribution, as workers would be assigned to specific teams responsible for managing these clustered regions. In other words, by focusing on areas where the Index is balanced, this approach ensures more efficient redistribution while reducing overall transportation efforts.
Clustering Idea for Implementing Spatial-Temporal Balance
Common Clustering Method
Initially, a K-Means clustering approach was tested to identify areas where the difference between bike rentals and returns was close to zero. By adjusting the number of clusters to match Seoul’s 25 districts, the analysis of June 2023 data showed that clusters with more districts had net volume averages closer to zero, indicating a better balance between rentals and returns. In contrast, smaller clusters with fewer districts exhibited greater imbalance.
Further testing with other clustering methods, such as the Gaussian Mixture Model (GMM), produced results similar to those of K-Means. However, neither method fully captured the underlying bike movement patterns, as these clustering models were unable to account for the dynamic mobility data within the bike-sharing system. This suggested that the algorithms might not be well-suited to the structure of Ddareungi’s data, highlighting the need for alternative modeling approaches.
Since Ddareungi’s data reflects bike movements between stations, it is logical to treat these movements as links within a graph, with rental and return stations acting as nodes. By applying a community detection method, clusters can be identified based on the most frequent bike movements. This graph-based approach, which focuses on actual bike movement patterns, could lead to more efficient bike redistribution and yield improved clustering results.
Network Detection Method
The approach involves treating the movement of bikes between rental and return stations as links between nodes, thereby creating a graph. By identifying clusters with the highest number of links, it’s possible to detect community divisions where bikes tend to circulate internally. This can significantly enhance the efficiency of bike redistribution across the network.
This is where network community detection comes into play. Community detection is a method that divides a graph into groups with dense internal connections. Applied to Ddareungi data, it helps track rental-return patterns by clustering areas where rentals and returns are balanced. By identifying these clusters, we can detect regions that maintain spatial balance, with more compact clusters reflecting higher modularity.
Modularity measures how densely connected the links are within a community compared to the connections between different communities. It ranges from -1 to 1, with values between 0.3 and 0.7 indicating the existence of meaningful clusters. Higher modularity signifies stronger internal connections, leading to more effective clustering.
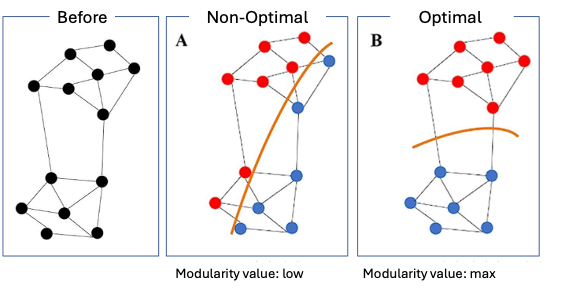
To optimize modularity, the Louvain algorithm was tested. This algorithm works in two phases: In Phase 1, nodes are assigned to communities in a way that maximizes modularity. In Phase 2, the network is simplified by merging the links between communities, further refining the structure and improving cluster detection.
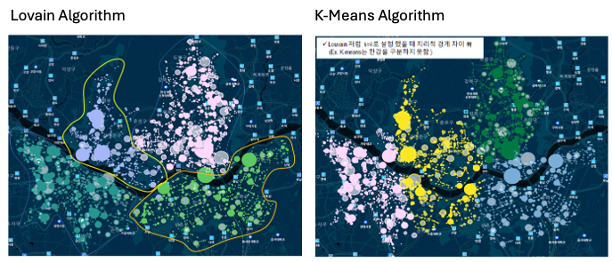
When applied to Ddareungi data, the Louvain algorithm significantly outperformed K-Means clustering, which relies on Euclidean coordinates. The average net deviation, where 0 is ideal, dropped sharply from 21.19 with K-Means to 9.23 using Louvain, indicating a more accurate clustering of stations. Unlike K-Means, which ignores key geographical features like the Han River, the Louvain algorithm took Seoul’s geography into account, resulting in more precise and meaningful clusters.
The following map comparison highlights this difference, showing how Louvain provides clearer cluster differentiation across the Han River, whereas K-Means fails to capture these geographic distinctions.
Understanding the Cycle
I likened Ddareungi bike movement to the flow of water. Just as the total amount of water on Earth remains constant, the total number of Ddareungi bikes stays fixed. This analogy helps conceptualize the system as spatially and temporally closed, where clustering can maintain balance.
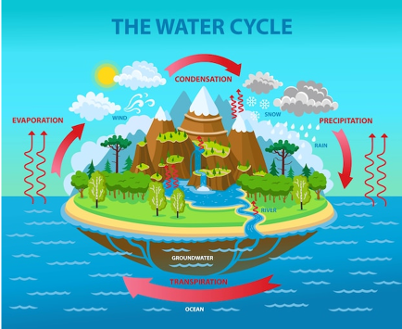
Temporal imbalances can be managed by tracking the flow of bikes throughout the day. For instance, business districts experience high demand in the morning but accumulate excess bikes by evening, while residential areas face the opposite situation. Redistribution efforts can be minimized by transferring surplus bikes from business districts to residential areas overnight, before the morning commute begins. After the morning rush, bikes concentrate in business districts but are naturally redistributed as users ride them back to residential areas during the evening commute.
Although there is some uncertainty in the evening, as it’s unclear whether users will choose bikes for their return journey, any surplus can still be addressed overnight as part of the regular redistribution cycle. This ensures that before the next morning commute, any leftover bikes in business districts are moved to residential areas as mentioned above. When viewed over a full day, these fluctuations tend to balance out, reducing the need for excessive intervention.
To manage these imbalances more effectively, a rental-return index was used to prioritize stations for redistribution, ultimately reducing operational costs. Additionally, network community detection, particularly through the Louvain algorithm, provided more accurate clustering than previous methods. This approach better reflected Seoul’s geography, especially by distinguishing clusters across the Han River, greatly improving redistribution strategies.
By viewing Ddareungi as a system striving for both spatial and temporal balance, shortages can be managed more efficiently. This approach not only optimizes the Ddareungi system but also offers valuable insights for enhancing the management of other shared resource systems.
To view the article in Korean, please click here.