Yeonsook Kwak (MBA, 2024)
Sleep. It’s something we all need but often take for granted. As people start to realize just how important it is for our health and well-being, the question of how we can detect and understand our sleep states becomes more critical. This paper takes a closer look at that question, breaking it down into five key sections that will guide us toward better solutions and deeper understanding.
The paper starts by looking at accelerometer data for sleep tracking. This method is popular because it’s non-intrusive and works well with wearable devices for continuous monitoring. It explains how Euclidean Norm Minus One (ENMO, standardized acceleration vector magnitude)-based metrics can be a simple alternative to complex medical exams. Next, it reviews current research, highlighting the strengths and weaknesses of different methods. It also points out gaps in the accuracy and reliability of existing models.
Building on the insights gained from the review, the paper then addresses specific challenges, such as sleep signal variability and irregular sleep intervals. It outlines data preprocessing techniques designed to manage these issues, thereby improving the robustness of sleep state detection. To achieve this, a novel likelihood ratio comparison methodology is introduced, which aims to increase generalizability, ensuring effectiveness across diverse populations. Lastly, the paper concludes by acknowledging the limitations of the current study and proposing future research directions, such as incorporating additional physiological signals and developing more advanced machine learning algorithms.
Sleep Tracking Based on Accelerometer Data
According to the National Health Insurance Service, 1,098,819 patients visited hospitals for sleep disorders in 2022, a 28.5% increase from 855,025 in 2018. As the number of sleep disorder patients rises, interest in high-quality sleep is also growing. However, since the causes and characteristics of sleep disorders vary among patients, there is a burden of needing different treatment methods and diagnostic tests.
Patients suspected of having sleep disorders usually undergo detailed diagnosis through polysomnography. This test involves various methods, including video recording, sleep electroencephalogram (EEG, using C4-A1 and C3-A2 leads), bilateral eye movement tracking, submental EMG, and bilateral anterior tibialis EMG to record leg movements during sleep.
Polysomnography has its limitations. Patients must visit specialized facilities, and it’s only a one-time session. As a result, there’s increasing demand for tools that offer more convenient and continuous sleep monitoring.
Measuring Movement Using Accelerometer Data
Recently, health management through wearable devices has become increasingly common, enabling real-time data collection. Wrist-worn watches can monitor activity levels, and for sleep measurement, both an accelerometer sensor and a photoplethysmography (PPG) sensor are typically used.
The accelerometer sensor tracks body movements, while the PPG sensor uses light to measure blood flow in the wrist tissue, which helps measure heart rate. Although using data from both sensors could improve the accuracy of sleep measurement, this study only uses accelerometer data due to limitations on data usage. The reasons for this decision will be explained further on.
The accelerometer data consists of three axes, as shown in the figure below [1].
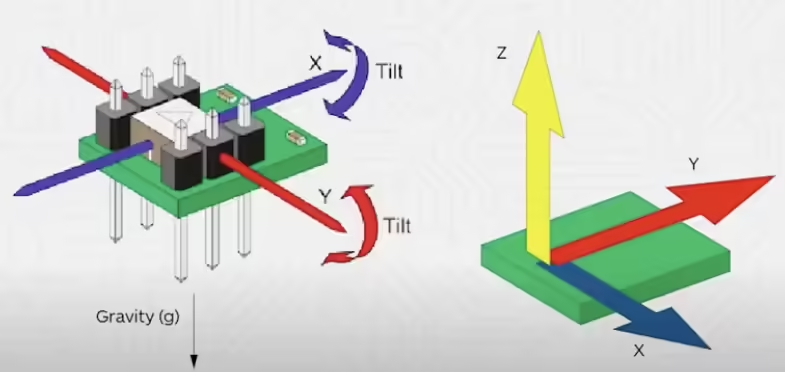
The $x$-axis represents changes in the direction that moves horizontally to the ground, the $y$-axis shows changes in the lateral direction of movement (e.g., how much the arms swing to the sides), and the $z$-axis indicates changes in the vertical direction of movement (peaking when the legs cross over during walking). It is important to understand that each axis’s function depends on the sensor’s reference axes. If these reference axes change, movement is usually measured based on the axis that shows the biggest change in values.
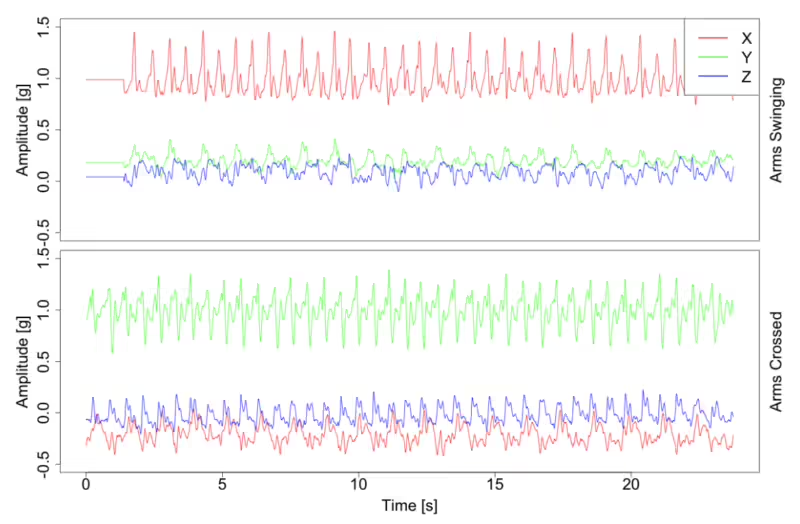
The graph below shows an example of 3-axis data [4]. This graph shows how the measurements change when walking with the arms swinging compared to walking with the arms held still. The changes in the $x$, $y$, and $z$ axes represent changes in the mean values, and it can be seen that the signal shown in green, when the arms are fixed, has the most significant variation. Therefore, accelerometer data can vary for the same action if the sensor’s position or reference axes change.
Making Useful Variables Through Transformation
To solve the problem of axes changing when the sensor’s orientation shifts, it is important to convert the data into straightforward yet informative variables. Many studies used summary metrics (or summary measurements). This combines the $x$, $y$, and $z$ axis values into a single value, thereby reducing the impact of changes in sensor orientation.
Examples of summary metrics include Euclidean Norm Minus One (ENMO, standardized acceleration vector magnitude), Vector Magnitude Count (VMC), Activity Index (AI), and Z-angle (wrist angle). Let’s take a closer look at ENMO and Z-angle, as they relate to the signal data from wearable devices discussed earlier.
As shown in the accelerometer diagram in Figure 1, when interpreting the dynamic acceleration of sensor data, it’s important to consider the effect of gravity (g). Therefore, to standardize the linear transformation of the three-axis values, a variable that subtracts gravitational acceleration is referred to as the ENMO variable. This can be expressed mathematically as follows.
\begin{equation} \label{eq:ENMO}
ENMO = max(0, \sqrt{x^{2}+y^{2}+z^{2}} – 1)
\end{equation}
The Z-angle is a summary metric for the wrist angle, which can be considered as the angle of the arm relative to the body’s vertical axis. It can be expressed using the following formula.
\begin{equation} \label{eq:Z-angle}
Z-angle = tan^{-1}\left(\frac{a_{z}}{\sqrt{a_{x}^2 + a_{y}^2}}\right) \cdot \frac{180}{\pi}
\end{equation}
To gain an intuitive understanding, let’s look at the actual ENMO values measured in real-life situations. Figure 3 below is a table summarizing the ENMO measurements during daily activities [2].
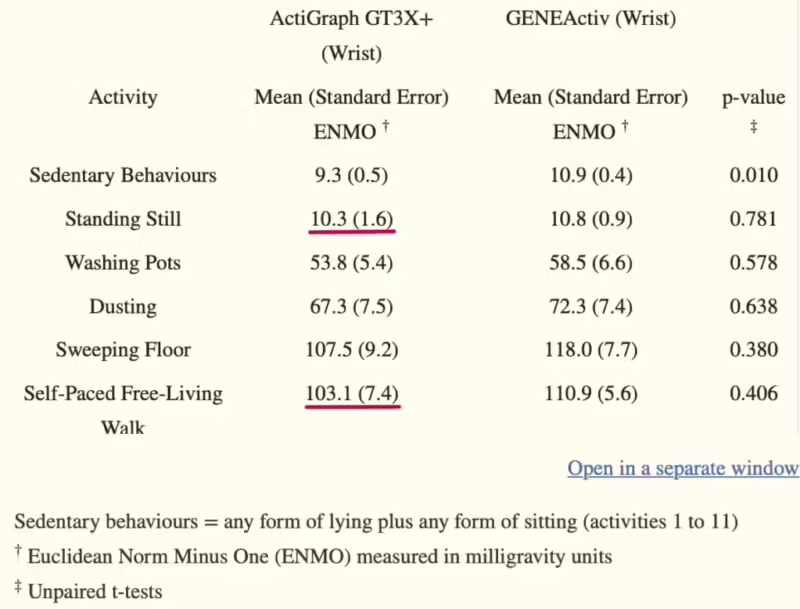
When standing, the ENMO was measured at an average of 1.03g, while it increased to 10.3g during everyday walking. This clearly demonstrates that the ENMO value is lower with minimal movement and rises as activity levels increase. In other words, since humans do not always move at a constant speed like robots, activity levels can be measured using acceleration.
While it may appear that raw $x$, $y$, and $z$ axis data offers more information due to its detail, this study seeks to demonstrate that condensing this information into a single summary metric doesn’t significantly impact our ability to accurately estimate sleep states.
Additionally, a basic model revealed that excluding Z-angle data does not result in significant information loss. When we used a tree model to evaluate the explanatory power of variables with statistical metrics from both Z-angle and ENMO, the ENMO variables were found to be much more important. In fact, all of the top 10 most important variables were related to ENMO. Since the importance of Z-angle variables was significantly lower, this study will focus on using ENMO as the primary basis for addressing the problem.
Review of Previous Studies
Existing Methodologies Focused on Optimization
Earlier, we explored several summary measurement variables, such as ENMO, VMC, AI, and Z-angle. More recently, research has been focused on identifying new summary measurements, like MAD (Mean Absolute Deviation), using axis data collected from accelerometer sensors. This kind of variable transformation requires advanced domain knowledge, and the process of validating these reduced variables is complex.
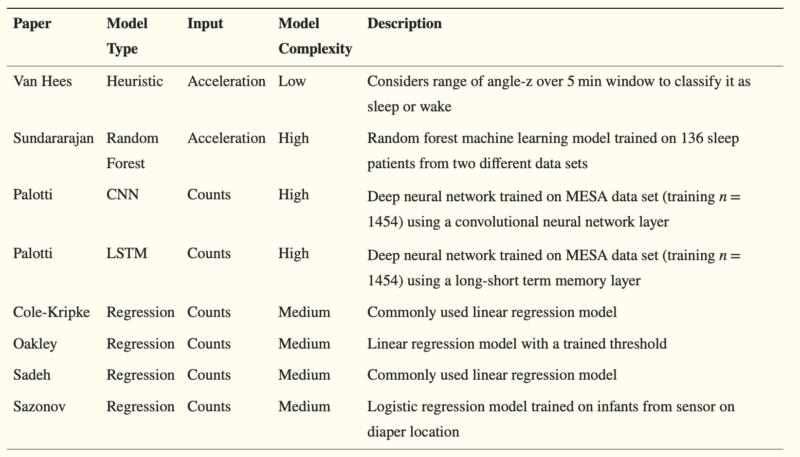
In previous studies, various summary measurements were investigated, and temporal statistics—such as overlapping or non-overlapping deviations, averages, minimums, and maximums at one-minute intervals—were used for classification or detection through machine learning models, heuristic models, or regression models. Figure 4 below summarizes the key methodologies from previous research [5].
Additionally, the evaluation metrics used in sleep research are as follows [2]:
- Sensitivity (actigraphy = sleep when PSG = sleep)
- Specificity (actigraphy = wake when PSG = wake)
- Accuracy: total proportion correct
- The amount of Wakefulness After Sleep Onset (WASO): the total number of awakenings during the sleep period
- SE (Sleep Efficiency): the proportion of sleep within the periods labeled by polysomnography
- TST (Total Sleep Time): calculated as the sum of sleep epochs per night
Limitations of Optimization and Increased Sensitivity to Changes in Data Patterns
Machine learning models like Random Forests and neural networks, such as CNNs (Convolutional Neural Networks) and LSTMs (Long Short-Term Memory networks), are considered “high complexity” due to their focus on achieving high accuracy. This often results in having a large number of parameters, which increases the risk of overfitting. When overfitting occurs, the model might learn the noise in the training data instead of the actual patterns, especially if there isn’t enough data.
As a result, the model’s performance can decline when applied to new dataset. In practical research, therefore, these high-complexity models sometimes struggle to accurately detect the exact moments of falling asleep or waking up. By focusing too much on optimization, they have overlooked the importance of generalization.
Are simpler models, like regression models, free from optimization issues? Although regression models are generally less sensitive to noise, they rely on the assumption that the data follows a normal distribution. If this assumption is not met, the standard error of the correlation coefficients can be high relative to the coefficients themselves. This increases the p-value, reducing the significance of the correlation and making the model’s results less reliable.
Since sleep data often does not follow a normal distribution, additional optimization is needed for regression models like the Cole-Kripke[3] and Oakley[6] models. While these simpler models may be less accurate with target data compared to machine learning or neural network models, their low complexity and optimized adjustments make them useful as baseline models in research, often used alongside polysomnography.
When users have only recently started using wearable devices, there is often a need to classify sleep states with limited data. Early data may lack representativeness, making it challenging to rely on data-intensive models from the machine learning or deep learning fields. Traditional regression models that require extensive optimization are also not sustainable in these cases. This challenge becomes even more significant when analyzing data from multiple users rather than just one. Therefore, this study aims to introduce data transformation and model transformation methodologies that can improve generalization performance.
Characteristics and Collection Methods of ENMO Data
Before diving into the detailed data preprocessing steps and methodologies that aim to overcome the limitations of previous research, let’s take a closer look at the characteristics of ENMO data.
ENMO signals are collected at 5-second intervals and can be analyzed in combination with sleep state labels assigned through sleep diaries. The criteria for labeling sleep states in the sleep diary are as follows:
- Sleep is assumed if the sleep state persists for at least 30 minutes.
- The longest sleep period during the night is recorded as the sleep state. However, there is no rule limiting the number of sleep episodes that can occur within a given period.
For example, if an individual sleeps from 1:00 to 6:00 and again from 17:30 to 23:30 on the same day, both sleep periods are valid and counted. This approach naturally accommodates different sleep patterns, such as early morning and evening sleep, which can be influenced by work schedules.
To help with understanding, let’s take a look at the sample data in the graph below. This data was collected over approximately 30 days from one individual, specifically looking at their Z-angle and ENMO signals. Sleep periods are marked as 0, active periods as 1, and -1 indicates cases where the label values in the sleep diary are missing due to device or recording errors.
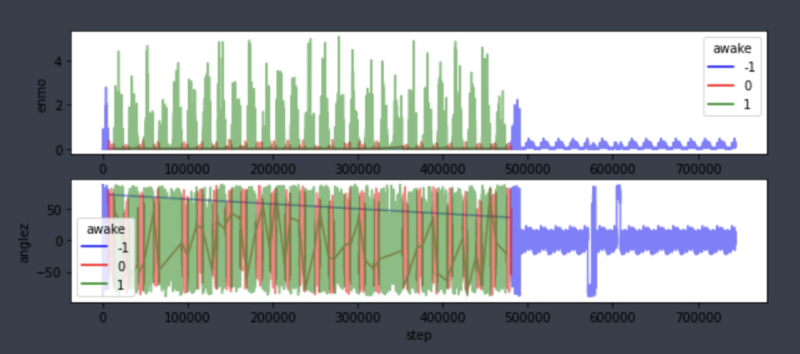
As expected, we can observe a noticeable periodicity as the sleep periods (0, in red) and active periods (1, in green) alternate. While not everyone exhibits the same sleep pattern, the overarching cycle of sleep and awake remains consistent. Therefore, this study will focus on using generalized data transformations to better distinguish between sleep and wake cycles. In the following section, we will introduce modeling methods that prioritize generalization.
The Z-angle data also showed a cyclic pattern. However, as mentioned earlier, ENMO data is significantly more important than Z-angle data and results in less information loss. Therefore, in the following methodologies, only the ENMO variable was used.
Considering Variability of Sleep Signals and Irregularity of Sleep Intervals
Interestingly, even during sleep, there are small fluctuations. This occurs because sleep consists of different stages, as many people know. These stages are usually classified based on the criteria shown in the diagram below.
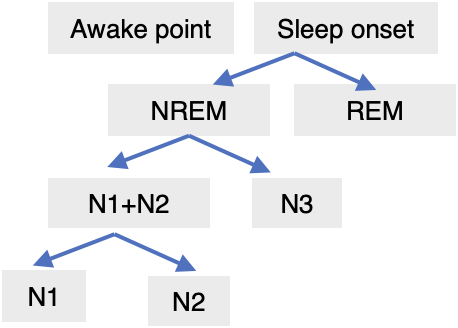
In the previous study by Van Hees, sleep stages were classified based on the same diagram. The concept of sleep stages suggests that body movements vary depending on the stage, which can cause subtle fluctuations in sleep signals. As shown in the ENMO data in Figure 5, the $y$ values during sleep periods (indicated by red bars) are not uniform.
It naturally occurred to me that if the signals during sleep periods could be processed into more consistent signals, detecting sleep states would become easier. The goal of stabilization is not to eliminate sleep signals entirely but to preserve their characteristics while maintaining relatively stable values compared to the variance in the raw data.
Building on this idea, we can conclude that generalization is achievable even when the amount of tossing and turning varies between individuals and across all users. While it might be tempting to skip over these complex processes, doing so would be unwise. Previous studies have often overemphasized optimization, which can lead to problems like overfitting. To prevent this, it’s well-known that regularization techniques, such as the Lagrange multiplier method, are commonly used.
In this study, we aimed to develop a methodology with superior generalization performance by processing the data based on insights gained from a more detailed analysis of the data characteristics and modifying the model accordingly. I hope this discussion helps convey the importance of having a solid rationale in the data preprocessing stage to build a reliable model.
Stabilizing Sleep Signals Through Data Transformation
The initial approach to stabilizing sleep signals focused on removing outliers by applying standard filtering techniques. A method similar to Fast Fourier Transform (FFT) was employed, specifically using Power Spectral Density (PSD). PSD is effective for analyzing the distribution of FFT2 density across different frequency bands.
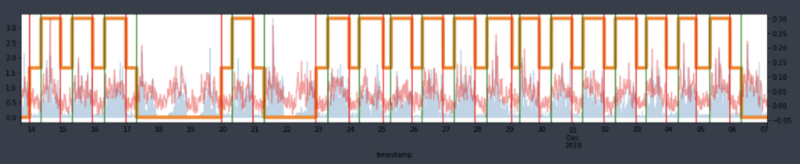
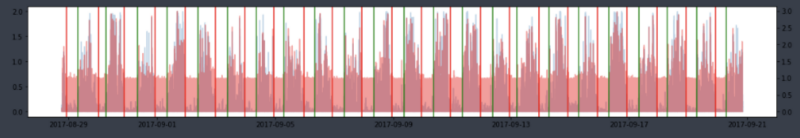
However, after applying PSD to the ENMO signal data, we found that 99.8% of the entire dataset remained, failing to achieve the intended stabilization of sleep-specific signals. As shown in Figure 6, the variability of the processed ENMO signals (indicated by the red bars) during sleep periods (the area between the red and green lines, in that order) remained evident.
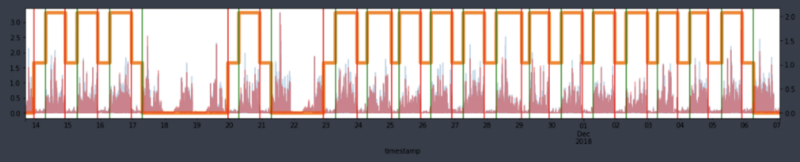
To see if smoothing the data would resolve the issue, a Kalman filter was applied. Despite incorporating covariance from previous data, it failed to stabilize the sleep signals. As shown in Figure 7, much of the variability in the processed ENMO signals during sleep periods persisted. Additionally, the Kalman filter performed poorly in detecting sleep states and had higher computational costs compared to PSD, mainly due to the use of covariance from prior data.
Finding Periodicity in Irregular Intervals
There was an aspect that was overlooked during the initial data transformation process. We missed one of the most important characteristics of the given data: even for a single user, the times of falling asleep and waking up are not consistent. Therefore, this time we used the Lomb-Scargle periodogram, a method designed to detect periodic signals in observations with uneven spacing.
Figure 11 below visualizes the data after applying the Lomb-Scargle periodogram. Although the signals in the sleep periods appear almost uniform due to the long duration of the entire dataset, zooming in on specific intervals reveals that while the variability has been reduced, the characteristics of the signals have been preserved as much as possible.
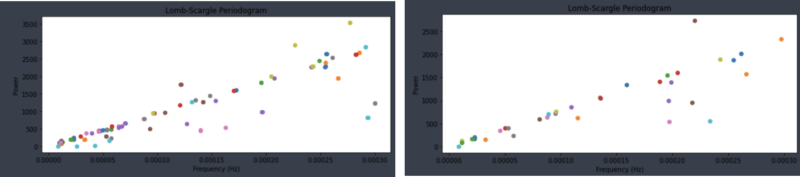
Beyond applying this to a single ID value, we also examined the results for all IDs without missing data. The dominant frequency showed a linear pattern with power. Therefore, for frequencies observed within the regression line, we determined that filtering using the typical values within the linear range would not significantly reduce the accuracy of the predictions.
Signal processing methods like the Lomb-Scargle periodogram, which align with the principles of FFT, need sufficient data to detect periodic patterns. In the case of ENMO data, at least a full day must pass to observe a complete cycle of sleeping and waking.
Thus, if the sample period for each ID was less than 3–5 days or there were many device omissions, filtering was done using the dominant frequency data from the training data. When there was at least about 5 days of data available, filtering was applied individually based on each ID.
Likelihood Ratio Comparison
In the previous section, we explored how data can be transformed as a method of generalization. In this section, we will examine how model transformation can improve generalization performance.
Sleep and Awake Period Distributions
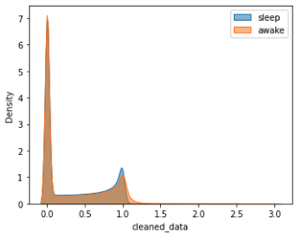
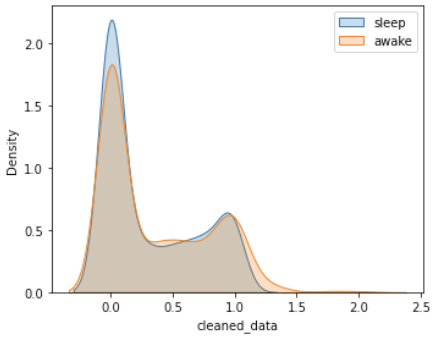
When examining the ENMO signal data after applying the Lomb-Scargle periodogram, neither the awake nor the sleep period data exhibited a uniform distribution.
As shown in Figure 10, the distribution shapes of the two periods also differ. Notably, there is a distinct difference in the shape of the distribution peaks: the joint distribution peak during sleep periods forms a smooth curve, whereas the peak during awake periods appears more angular.
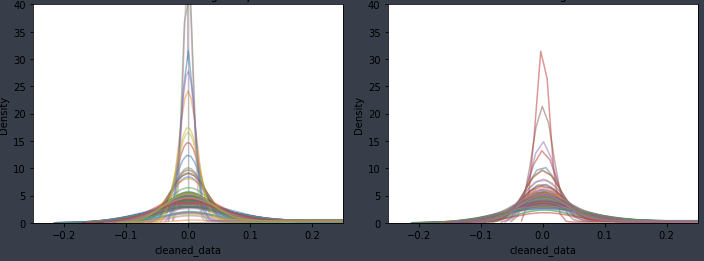
Interestingly, upon closer inspection, despite the different distribution shapes, the peak values for each ID are clustered around 0 on the x-axis, whether it’s during sleep or awake periods.
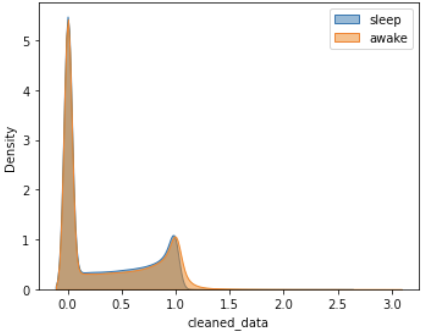
Similarly, in both Figure 11a (entire dataset) and Figure 11b (9% of the entire dataset), the peak values of the sleep and awake distributions did not change significantly. Additionally, the peak values in Figure 12, which shows 800 randomly sampled observations from Figure 11b, also showed minimal variation.
Using Sleep and Awake Period Distributions
We examined whether the peak values of the distribution functions were different or the same. This was part of an effort to apply a likelihood ratio (LR) comparison method by utilizing the distribution information of sleep and awake periods to generalize the sleep state detection method. If the distributions are known, approaching the problem using Maximum Likelihood Estimation (MLE) is the most appropriate method. Similarly, we aimed to model based on the Likelihood Ratio (LR) by using the information from the sleep and awake distributions.
Sleep and awake distributions may not follow commonly known probability density functions (e.g., Gaussian, Poisson, etc.) and are often irregular. As an alternative, we used distributions derived from kernel density estimation (KDE). Kernel density estimation involves creating a kernel function centered on each observed data point, summing these, and then dividing by the total number of data points. Typically, the optimal kernel function is the Epanechnikov kernel, but for computational convenience, the Gaussian kernel is frequently used. In this study, we also used the Gaussian kernel.
First, let’s explain how the LR method was applied using equations. $LR = \frac{L_{1} (D)}{L_{0} (D)}$.
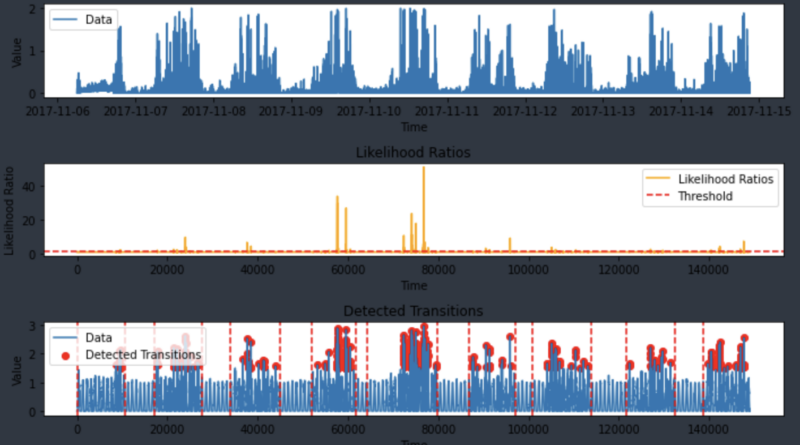
The likelihood ratio can be calculated for each data input point, where $L_{0} (D)$ represents the likelihood of the data under the null hypothesis, indicating a higher probability of being a sleep signal. Conversely, $L_{1} (D)$ represents the likelihood under the alternative hypothesis, indicating a higher probability of being an awake signal. If the LR is greater than a threshold, it suggests that the data is more likely under the alternative hypothesis (awake signal).
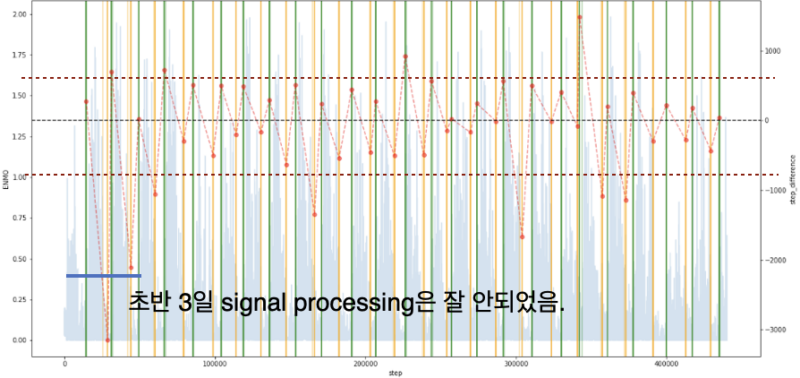
Figure 13 visualizes the results of sleep state detection using the above generalization methodology for a single ID. In the graph below, you can see that the lowermost graph finds as many points as possible between the first activity signal point (moment of waking up) and the last point (moment of falling asleep) after data transformation.
From a computational efficiency standpoint, the likelihood ratio (LR) method is also advantageous. When measuring computation time, it was observed that data transformation occurs simultaneously with data input, allowing the LR results to be produced quickly. Processing 39,059 data points all at once took about 7 seconds. For one day’s worth of data for 10 users (17,280 data points), it took around 1 minute and 40 seconds in total.
As expected, this method, which depends on distribution, doesn’t detect cases where the device is missing. However, visual checks using Figure 13 showed that the method works well in detecting signals without label values, as long as the device wasn’t missing.
To assess the robustness of the model, this study proposes using the time difference between predicted values and label values as a performance metric. Since the likelihood ratio method introduced above focuses on generalization, we determined that traditional evaluation metrics from existing sleep research, which are geared toward optimization, would not be applicable.
New Evaluation Metric for Assessing Model Robustness
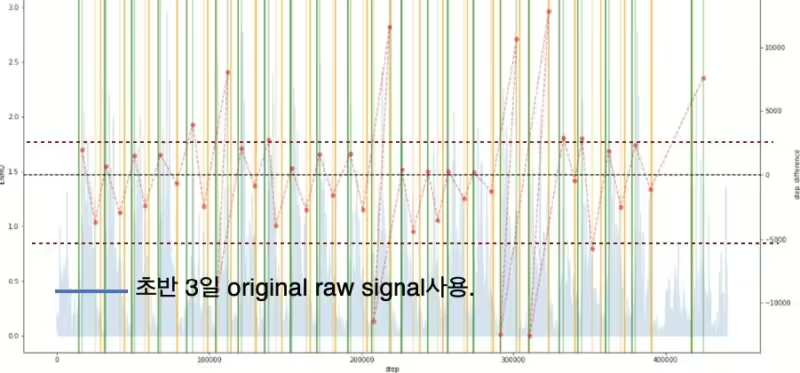
When comparing the time difference between the model’s predicted values and the label values, the model tends to predict the moment of falling asleep earlier than the actual label values and the moment of waking up later than the actual labels. To understand the cause of this, we applied the LR method to the raw, unprocessed ENMO signals to detect sleep states.
As shown in Figure 14a, even when using unprocessed ENMO signals, the tendency for predictions to be early or late remained the same. This suggests that these tendencies are inherent to the collected ENMO signals themselves. It is expected that if additional data, such as pulse rate or other complementary information, is used in the future, the time difference (time diff) could be reduced.
Limitations and Future Research Plans
In the previous section, we briefly discussed assessing the performance of the likelihood ratio comparison method by using the time difference between predicted values and label values. To provide a more objective evaluation, we will now also examine the results of applying this method to IDs that were not included in the training data (test set).
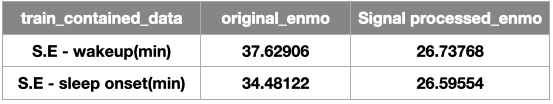
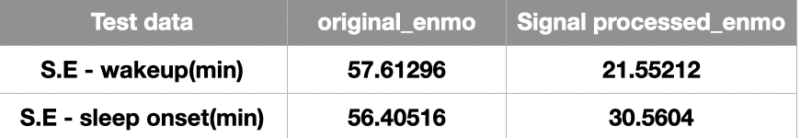
The numbers shown above are the average of the standard errors of time differences (within individual standard error, SE) calculated for each ID. Figure 15a shows the results of applying the likelihood ratio comparison model to 10 randomly selected IDs included in the training data, while Figure 15b shows the results using 3 randomly selected IDs that were not included in the training data.
Verifying the Robustness of the Likelihood Ratio Comparison
The results showed that the processed ENMO signals did not exhibit significant performance differences between the training and test data sets, reaffirming the robustness of the generalization-focused methodology. Although the processed ENMO signals displayed understandable levels of variability, the unprocessed original ENMO signals showed a significant increase in average standard error.
Additionally, Figures 15a and 15b highlight the contribution of data transformation to performance improvement. The original ENMO signals, without any preprocessing, had a higher average standard error compared to the processed ENMO signals. This difference was more pronounced in the test set (Figure 15b), where the average standard error for the processed ENMO signal data was reduced by over 20 minutes for both wakeup and sleep onset times. This underscores the importance of investing effort into data preprocessing to enhance generalization performance.
The training set’s performance was validated using random samples from 10 different IDs, while the test set included three additional randomly selected IDs not used in the training distribution, further rigorously testing the model’s generalization performance. For reference, the total number of nights analyzed across the 13 IDs was approximately 110 days, suggesting that a sufficiently long period was utilized for comparing average standard errors.
Key Research Findings
In summary, this study focused on generalization rather than optimization. Efforts were made to enhance generalization performance, starting from the data transformation stage. Using raw data statistics based on accelerometer data can increase dimensionality and make the data more susceptible to outliers and noise, highlighting the need for data preprocessing. Additionally, since sleep patterns are not consistent, it was necessary to stabilize the data by applying the Lomb-Scargle periodogram, which can detect periodicity in unevenly spaced data.
From a modeling perspective, rather than enhancing the fit for each individual data point as is common in traditional machine learning or deep learning models, this study utilized distribution data rich in information. Distributions contain more information than variance, leading to a structure that is inherently more efficient from a modeling standpoint. As a result, even users who have only recently started wearing wearable devices can benefit from early detection (though at least one hour of data is needed), improving the practical utility of the device.
Furthermore, the LR method offers the advantage of high computational efficiency. Compared to complex models like machine learning or deep learning, as well as traditional models using rolling statistics, the computational efficiency of the LR method is significantly higher. In the same vein, the LR method is easier to maintain. With its lower model complexity and sequential execution of data preprocessing and LR model inference stages, subsequent modifications to the model structure are also straightforward.
Future Research
Currently, only ENMO signal data is used, but incorporating more supplementary variables (e.g., heart rate) is expected to make sleep state detection more refined. Enhancing performance may also be possible by implementing more detailed updates during data preprocessing for each individual ID. In this study, the period for allowing the use of past distribution data and determining the dominant frequency was chosen through basic experiments, but future studies could consider more precise adjustments.
The heterogeneity that exists between individuals should also be considered. Future studies could achieve higher accuracy by analyzing different groups (e.g., those with above-average activity levels vs. those with minimal activity) rather than simply adjusting the current threshold values. Expanding the study population could also contribute more to public healthcare research by reflecting demographic characteristics among individuals, which would be valuable for both business and sleep research perspectives.
Continually expanding the variety of data has great potential for advancing sleep research. For example, the Healthy Brain Network, which provided the data used in this study, aims to explore the relationship between sleep states and children’s psychological conditions. This highlights the increasing importance and interest in using sleep state measurements as a supplementary tool for understanding human psychology and social behavior.
Meaningful Inference Amid Uncertainty
Understanding complex issues depends on how the available information is utilized. The data used in this study are signal data, and most signal measurements inherently contain noise, which introduces uncertainty. Moreover, understanding sleep states requires domain expertise, and direct measurement is often difficult. Despite these difficulties, this research made significant efforts to predict human sleep states through indirect measurements or partial observations, aligning with recent advances in wearable devices.
In conclusion, optimization and generalization are naturally in a trade-off relationship. While this paper focused on generalization, the emphasis on optimization should be adjusted dynamically based on how much precision is required from a business perspective. Just as the phrase “one size fits all” is contradictory and almost impossible to achieve perfectly, it is important to recognize that choices must be made depending on the data and the specific context.
To view the article in Korean, please click here.
References
[1] URL https://insights.globalspec.com/images/assets/263/1263/Accelerometers-04-fullsize.jpg. 2
[2] Kishan Bakrania, Thomas Yates, Alex V Rowlands, Dale W Esliger, Sarah Bunnewell, James Sanders, Melanie Davies, Kamlesh Khunti, and Charlotte L Edwardson. Intensity thresholds on raw acceleration data: Euclidean norm minus one (enmo) and mean amplitude deviation (mad) approaches. PloS one, 11 (10):e0164045, 2016. 4
[3] Roger J. Cole, Daniel F. Kripke, William Gruen, Daniel J. Mullaney, and J. Christian Gillin. Automatic sleep/wake identification from wrist activity. Sleep, 15(5):461–469, 09 1992. ISSN 0161-8105. doi: 10.1093/sleep/15.5.461. URL https://doi.org/10.1093/sleep/15.5.461. (document)
[4] Marta Karas, Jiawei Bai, Marcin Str´aczkiewicz, Jaroslaw Harezlak, Nancy W. Glynn, Tamara Harris, Vadim Zipunnikov, Ciprian Crainiceanu, and Jacek K. Urbanek. Accelerometry data in health research: challenges and opportunities. bioRxiv, 2018. doi: 10.1101/276154. URL https://www.biorxiv.org/content/early/2018/03/05/276154. (document), 3
[5] Miguel Marino, Yi Li, Michael N. Rueschman, J. W. Winkelman, J. M. Ellenbogen, J. M. Solet, Hilary Dulin, Lisa F. Berkman, and Orfeu M. Buxton. Measuring sleep: Accuracy, sensitivity, and specificity of wrist actigraphy compared to polysomnography. Sleep, 36(11):1747–1755, 11 2013. ISSN 0161-8105. doi:10.5665/sleep.3142. URL https://doi.org/10.5665/sleep.3142. (document)
[6] Nigel R Oakley. Validation with polysomnography of the sleepwatch sleep/wake scoring algorithm used by the actiwatch activity monitoring system. mini mitter co. Sleep, 2:0–140, 1997. (document)
[7] Matthew R Patterson, Adonay AS Nunes, Dawid Gerstel, Rakesh Pilkar, Tyler Guthrie, Ali Neishabouri, and Christine C Guo. 40 years of actigraphy in sleep medicine and current state of the art algorithms. NPJ Digital Medicine, 6(1):51, 2023. 5
