Donggyu Kim (MBA, 2024)
It’s difficult to maintain blood stock at safe levels
South Korea has recorded its lowest birth rate in history. In 2023, the country’s total fertility rate was 0.72, raising concerns about various future issues. Among them, the potential blood supply shortage due to low birth rates has come into focus. According to the Korean Red Cross, by 2028, the demand for whole blood donations is expected to exceed supply. Moreover, this gap is anticipated to widen further.
Blood shortages have long been a recurring problem. Especially during the winter season, the lack of blood donors causes hospital staff to worry about whether they can ensure a smooth supply of blood to patients. Despite these concerns, the blood shortage problem continues to worsen.
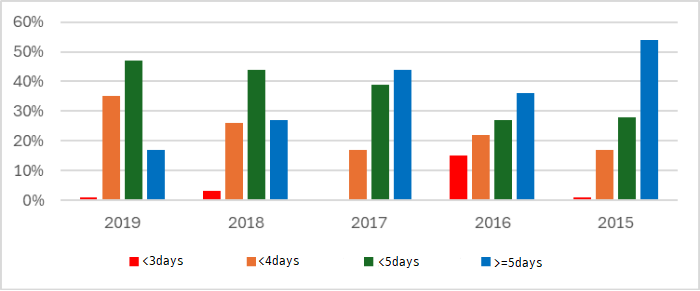
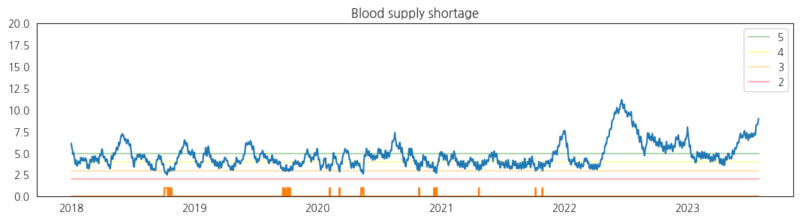
The Korean Red Cross considers a blood stock of more than five days to be at a “safe level”, while a stock of less than five days is regarded as a “shortage”. However, past data shows that the number of days the blood stock remains at a safe level has been decreasing.
Why is it difficult to maintain blood stock at a safe level? The reason is that both the supply and usage for blood are hard to control. Blood is used in medical procedures like surgeries, and reducing its usage would cause significant backlash. On the other hand, blood can only be supplied through donations, meaning supply is limited. Therefore, despite the efforts of the Korean Red Cross, it remains challenging to keep blood stock at a safe level.
Literature Review
This study aims to understand the dynamics of blood supply and usage to help address the issue of blood shortages. Additionally, the study measures the effects of “blood donation promotional activities”, one of the key factors in increasing blood supply, and propose efficient solutions.
Before delving into the analysis, let’s review how previous studies have approached blood supply and usage. Blood has the characteristics of a public good, so it’s heavily influenced by laws, and blood donation and management systems vary significantly between countries. Therefore, it was deemed difficult to apply research findings from other countries domestically, which is why I focused on reviewing domestic studies.
Yang Ji-hye(2013), Lee Tae-min(2013), Yang Jun-seok(2019), and Shin Ui-young(2021) focused on qualitative analysis by identifying motivations for blood donation participation through surveys. Kim Shin(2015) used multiple linear regression analysis to predict the number of donations by individual donors. However, personal information of donors was used as explanatory variables, and time series factors were not considered, making it difficult to understand the dynamics of blood supply and usage. Kim Eun-hee(2023) studied the impact of the COVID-19 pandemic on the number of donations, but her research had limitations, as it did not account for exogenous variables or types of blood donations. Unfortunately, previous studies did not focus on the dynamics of blood supply and usage, leaving little content to reference for this analysis.
Analysis of Blood Supply Dynamics
Selection of Analysis Subjects
From this section, I will introduce the analysis process. Rather than diving straight into the analysis, I will first clearly define the subjects of analysis. The Korean Red Cross publishes annual blood donation statistics, providing the number of donors categorized by group (age, gender, donation method, etc.). This study utilized that data for the analysis.
There are various types of blood donations. Depending on the method, donations are classified into whole blood, plasma, and platelets & multiple components. First, looking at plasma, approximately 68% of it is used as a raw material for pharmaceutical production, and it has a long shelf life of one year, making imports feasible. Therefore, in the case of plasma shortages, the issue can be resolved through imports, and as such, it is not our primary concern.
Next, platelet & multiple component donation has stricter criteria. Women who have experienced pregnancy are not eligible to donate, and it requires better vascular conditions compared to other types of donations. As a result, the gender ratio of donors is skewed at 20:1, raising concerns about sample bias and making it difficult to derive accurate estimates during analysis. Moreover, unlike whole blood, platelet & multiple component donations are primarily used for specific diseases. For these reasons, this study focuses solely on whole blood donations as the subject of analysis.
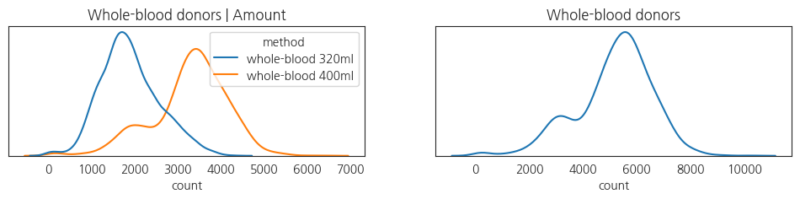
After selecting whole blood donations as the subject of analysis, one concern arose: whether to differentiate the data based on the amount of blood collected. The data I received is categorized by 320ml and 400ml amounts. Should I divide the data based on these amounts, just as we divide groups by gender? I decided that it would not be appropriate to make this distinction. Dividing the data by amount would distort the data structure because the amount is not a choice made by the donor but is determined by the donor’s age and weight. Since donors cannot choose the amount, the 320ml and 400ml data come from the same distribution, and dividing them would arbitrarily split this distribution. Therefore, in this analysis, I integrated the data categorized by amount of blood collected and defined it as the “number of donors” for the analysis.
The day of the week effect
Now that the analysis target has been clearly defined as the number of whole blood donors, let’s begin the analysis. Since the number of donors is time series data, it’s important to check whether it shows any seasonality. First of all, it is expected that the number of donors will vary depending on the weekly seasonality, specifically the day of the week and holidays. Let’s examine the data to confirm this.
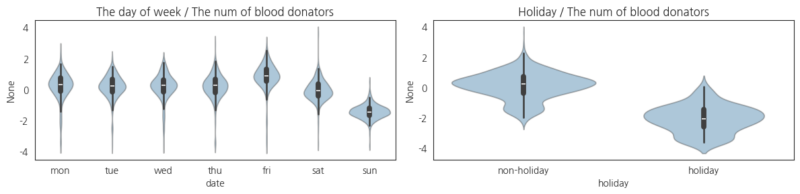
As seen in Figure 3, the number of blood donors is higher on weekdays and relatively lower on holidays. Let’s incorporate this information into the model. If the differences between groups in the data are overlooked and not included in the model, omitted variable bias (OVB) may occur, leading to inaccurate results. Therefore, it is important to identify variables that could cause group differences and incorporate them in the model.
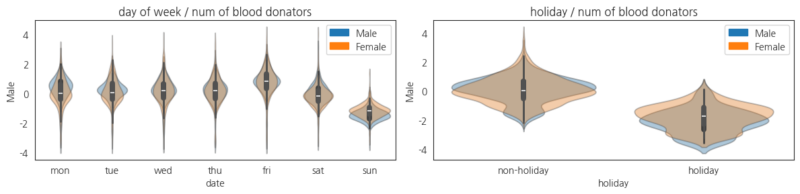
It is natural to think that if we are dividing the data by groups, we should also split the data by gender. However, there is no need to group the blood donor data by gender. This is because the purpose of the analysis is to understand the dynamics of the blood supply from the perspective of the entire population. If the goal were to analyze individual donation frequencies, gender would be an important variable. However, since we are examining data for the whole population, there is no need to separate by gender. Additionally, when the number of male and female donors is normalized for mean and variance, they show very similar patterns. For these reasons, we analyzed the data without dividing it by gender.
Next, let’s examine how the distribution changes as we divide the blood donor data into groups. Our goal is for the data to follow a normal distribution. Since a normal distribution indicates that no unexplained factors remain in the data.
First, let’s look at the distribution of the number of blood donors without dividing it into any groups. The distribution shows a bimodal pattern, which indicates that there are still many unexplained factors in the data. Now, let’s add the day-of-the-week effect that we discovered earlier to the model and see how the distribution changes. As seen in Figure 5, the distribution of weekday data after removing the day-of-the-week effect is no longer bimodal and has shifted to resemble a bell shape.
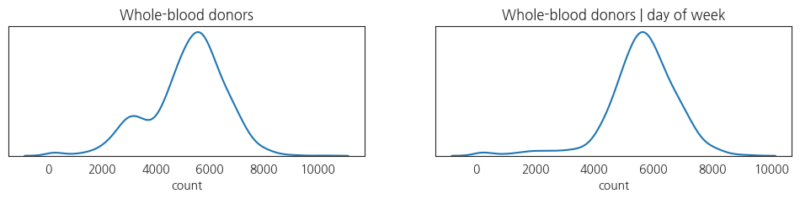
The distribution of the data after removing the day-of-the-week effect takes on a bell shape, but the long tail extending to the left is still concerning. We suspected this was due to a concentration of blood donations occurring on days when most donor centers are closed, and we incorporated this into the model. When we plotted the distribution using only data from non-holiday days, like how we removed the day-of-the-week effect, the tail disappeared.
Annual Seasonality
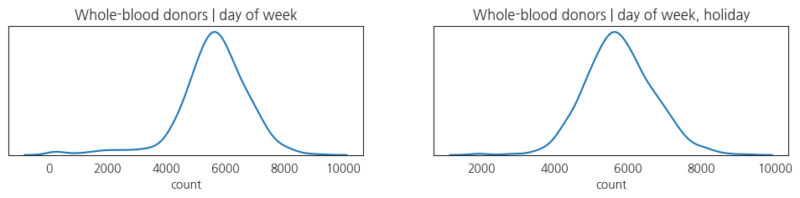
So far, we have identified day of the week and holidays as factors that influence the number of blood donors. Let’s express this in a regression equation and check the residuals. If the residuals do not follow a normal distribution, it means there are still unexplained factors affecting the number of blood donors. The regression equation for the number of blood donors based on day of the week and holidays is shown below.
\[ \left(bd_{320ml} \cup bd_{400ml}\right) \sim d_{dow}, d_{holiday} \]
This equation means that the response variable represents the number of whole blood donors, combining both 320ml and 400ml blood donations. The explanatory variables are the day of the week and holidays, which have been included in the equation in the form of dummy variables.
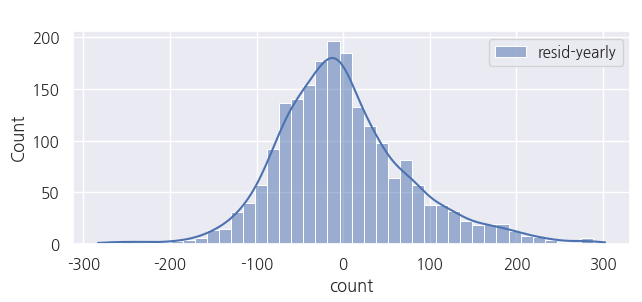
The residuals after removing the day-of-the-week and holiday effects no longer show the unusual patterns from the original data, such as the bimodal shape or long tail. However, when looking at the right side of the mean, there is an unusual pattern that wasn’t detected in the distribution of blood donors. This suggests that there are still factors not explained by the day-of-the-week and holiday variables. What could those factors be?
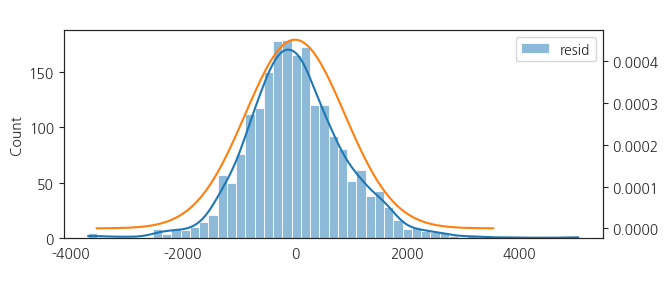
There are two types of seasonality: weekly seasonality, such as day-of-the-week effects, and annual seasonality, like spring, summer, fall, and winter. Since we’ve already accounted for weekly seasonality, let’s now consider annual seasonality. As mentioned earlier, we know that the number of blood donors tends to decrease in winter, so we can expect that annual seasonality exists. Let’s examine the data to confirm this.
Looking at Figure 8, we can see that the distribution of blood donors varies by month. Therefore, it is reasonable to conclude that annual seasonality exists in the number of blood donors, and we should incorporate this into the model. It is suspected that annual seasonality may be contributing to the unusual patterns in the residuals.
How can we incorporate annual seasonality into the model? The simplest method would be to include all days of the year using 365 dummy variables. However, this approach is inefficient as it uses too many variables. When there are too many variables, the model’s variance increases, and multicollinearity issues may arise. This is especially concerning because the number of blood donors does not fluctuate dramatically on a daily basis, so multicollinearity is likely. So, how can we capture similar information without using 365 dummy variables?
Let’s focus on the word “cycle”. When we think of cycles, sine and cosine functions come to mind. How about using sine and cosine functions to capture annual seasonality? This approach is called Harmonic Regression.
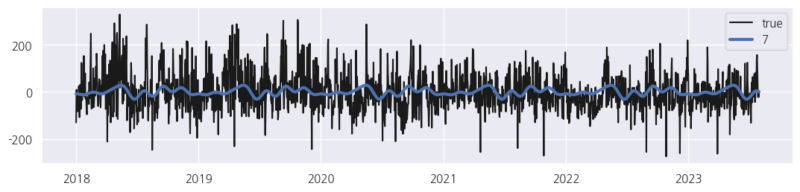
Figure 9 illustrates that annual seasonality is captured using appropriate sine and cosine functions. By using a method suited to the characteristics of the cycle, we were able to capture seasonality with a small number of variables. Of course, using temperature to capture annual seasonality is another option. This method has the advantage of being more intuitive and easier to control variables. However, there is annual seasonality in the blood donor data that cannot be fully explained by temperature alone, which is why harmonic regression was used to model the seasonality.
As a result of incorporating annual seasonality into the model, the unusual patterns in the residuals were eliminated. The regression equation with annual seasonality included is shown below.
\[ \left(bd_{320ml} \cup bd_{400ml}\right) \sim d_{dow}, d_{holiday}, sin_i, cos_i \]
Weather Effect
Do temperature and weather affect the number of blood donors? Upon investigating the data, we found that 70% of donors visit blood donation centers in person. This leads to a strong suspicion that temperature and precipitation, which influence outdoor activities, could have a significant impact on the number of blood donors.
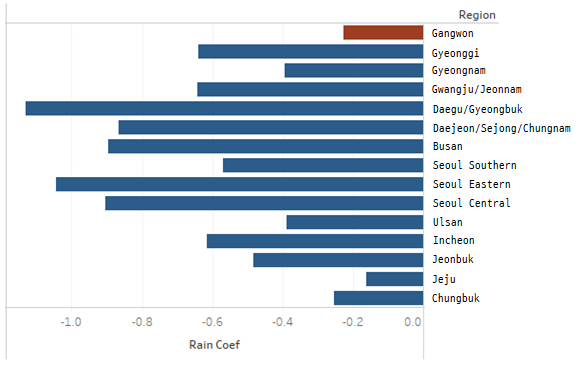
Since weather conditions vary significantly by region, we conducted the analysis separately for each region. We examined the significance of temperature and precipitation variables for individual regions. The results showed that precipitation negatively impacted the number of blood donors in all regions, while temperature did not have a significant effect. This is because the information provided by temperature was already captured when we incorporated annual seasonality into the model. The regression equation, including precipitation, is shown below.
\[ \left(bd_{320ml} \cup bd_{400ml} |region \right) \sim d_{dow}, d_{holiday}, sin_i, cos_i, rain_i \]
Dynamics of Blood Supply and Usage During the COVID-19 Period
In this section, we will examine how blood stock responds when a significant external shock occurs. Specifically, we will analyze the dynamics of blood stock during the COVID-19 period, which was the most significant recent shock.
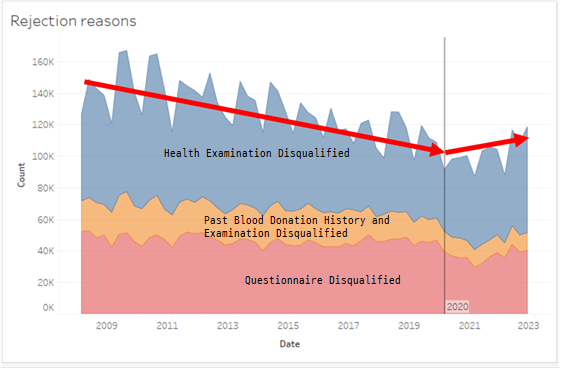
It is likely that maintaining blood stock above a certain level was challenging during the COVID-19 period. This is because population movement significantly decreased due to various quarantine measures and fears of infection. Moreover, as shown in Figure 12, the number of individuals ineligible for blood donation increased starting in 2020. This was due to the introduction of new health criteria during the COVID-19 period, which restricted blood donations for a certain period after recovering from COVID-19 or receiving a vaccine. For these reasons, we expect that blood stock levels decreased significantly during the pandemic. Let’s examine the data to see if our hypothesis is correct.
As seen in Figure 13, interestingly, blood stock levels were maintained above a certain level during the COVID-19 period. The blood stock never dropped below two days’ supply. How was the Korean Red Cross able to maintain blood stock above a certain level despite the external shock of the pandemic?
After controlling for the factors considered earlier and conducting a regression analysis, it was found that blood usage decreased by 4.25% during the COVID-19 pandemic. This reduction can be attributed to two factors: the intentional decrease in blood usage to maintain stock levels, and the natural decline due to the shortage of medical personnel and hospital wards during the pandemic.
A regression analysis on blood supply using the same variables showed a 5.3% decrease in supply. The reason blood stock levels were maintained during the COVID-19 period is that both usage and supply decreased at similar rates. However, considering the broader societal impact of the pandemic, the 5.3% decrease is relatively minimal.
Finding of the “Blood Shortage” Variable
A regression analysis of blood donor numbers by region showed that, in certain areas, the number of donors increased. Since COVID-19 did not occur only in specific regions, this contradicts common sense. Therefore, it is suspected that some factor during the pandemic may have contributed to an increase in blood supply in those areas. Additionally, the 5.3% decrease in the number of donors is likely offset by this increase factor.
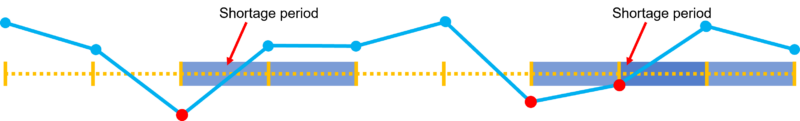
We anticipated that an increase factor might come into play during periods of blood shortage. Thus, we created a proxy variable called “Blood Shortage”. Days when blood stock dropped below a certain level, along with a defined period thereafter, were classified as “shortage periods”. This reflects the impact of specific measures taken by the Korean Red Cross during these periods.
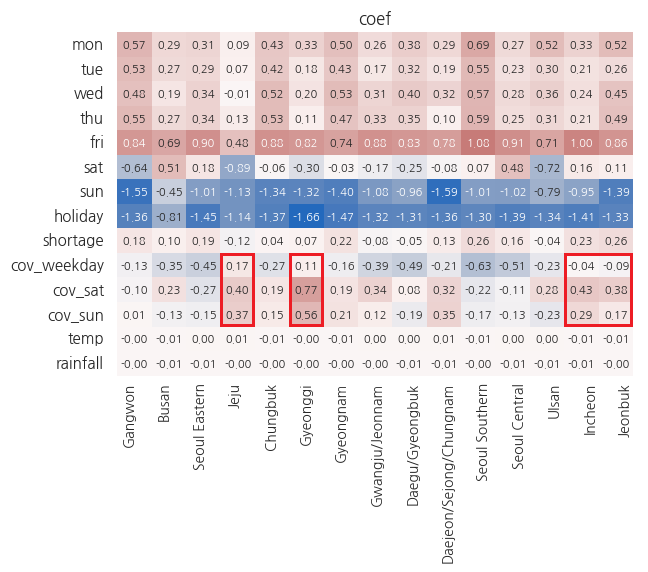
An analysis of the effect of the “blood shortage” on the number of blood donors showed that, in most regions, it had a positive effect on donor numbers. This supports the earlier hypothesis that some factor was increasing blood supply. Similarly, when examining the effect of the shortage condition on blood usage, we observed a decrease in usage during those periods. This indicates that the manual for blood supply shortages, which is triggered when blood stock levels fall below a certain threshold, worked effectively.
However, the increase factor associated with the “blood shortage” is likely only effective when the decrease in blood donors can be anticipated in advance. This is because the Korean Red Cross needs to predict a decline in donor numbers to respond through promotion efforts. Let’s verify this looking at the data.
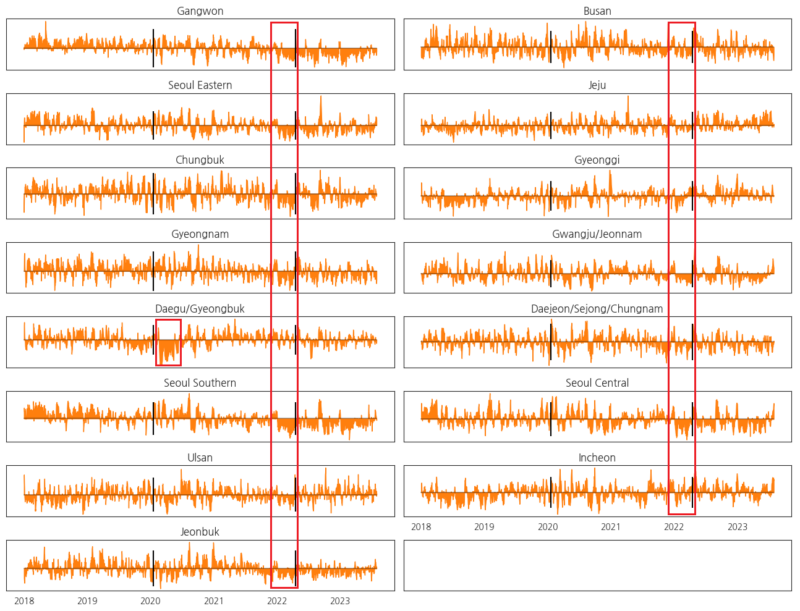
Looking at the model’s residuals, we can see that during the early stages of the COVID-19 pandemic in Daegu/Gyeongbuk and the Omicron wave—both unexpected events—the number of blood donors decreased. In other more predictable periods, donor numbers did not continue to decline, suggesting that the increase factor operated effectively. The reason blood stock levels were maintained during those times is that the mannual for blood supply shortage was activated, and the public became more aware of the shortage, leading to more proactive blood donations, which helped increase supply.
Measuring the Effect of Promotions
The Effect of the Additional Giveaway Promotion
During the COVID-19 period, the Korean Red Cross employed various methods to prevent a decline in the number of blood donors, including promotions, SMS donation appeals, and public service advertisements. Which of these methods was the most effective? If the effect can be accurately measured, the Korean Red Cross will be able to respond more efficiently to future blood shortages.
It would be ideal to measure the effect of all methods, but most were difficult to analyze due to a lack of data or one-time events. Fortunately, promotions were deemed suitable for quantitative analysis, so we focused on measuring their impact. Let’s examine how much promotions increased the number of blood donors.
The giveaway promotion was conducted in the same way across all regions for an extended period, so there should be no major issues in measuring its effect. To assess its impact, we created a dummy variable for “promotion days” while controlling for the variables we previously identified. The results showed that the response to the promotion varied by gender. Men responded strongly to the promotion while women did not show a significant response. However, does simply adding a dummy variable truly capture the pure increase driven by the promotion?
Using a simple dummy variable to capture the effect of the promotion period results in a mixture of both the “promotion effect” and the “trend during the promotion period”. For example, the number of blood donors in May and December differs. May sees more donors due to favorable weather, while December sees fewer. Therefore, simply adding a dummy variable makes it difficult to isolate the pure effect of the promotion, as the existing higher donor numbers in May may get mixed with the increase from the promotion itself. We need to consider how to separate these effects to accurately measure the promotion’s impact.
As shown in Figure 18, the giveaway promotion was conducted on a quarterly basis. Since each quarter shares similar seasonality, there is likely no significant change in the number of blood donors across quarters. To remove trends, the entire timeline was divided into quarters, and the pure promotion’s impact was measured.
After removing the trends, there is no significant difference in the promotion response between the male and female groups. Although there is some variance due to unexplained social factors, the average response is similar, leading to more accurate results compared to using a simple dummy variable.
The Effect of Special Promotions
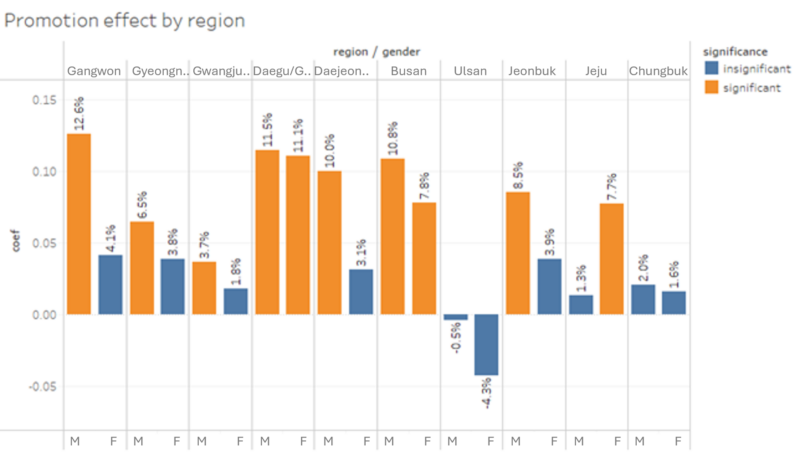
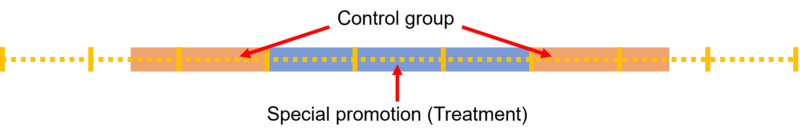
In addition to the giveaway promotion, the Korean Red Cross conducted various special promotions, including gift cards, souvenirs, travel vouchers, and sports event tickets. To accurately measure the effect of these special promotions, it is essential to remove the trends, just as with the giveaway promotion. In other words, we need to identify periods where there would be no differences except for the promotion. In this analysis, we examined the difference in the number of blood donors two weeks before and after the promotion period, as well as during the promotion period itself.
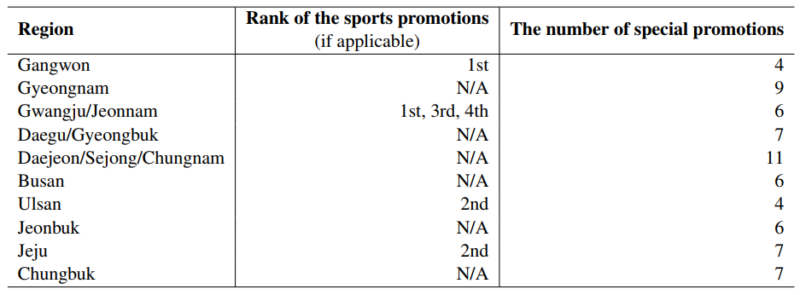
The increase rate in the number of blood donors by special promotions showed positive results in many regions. Among these, the offering sports viewing tickets was particularly effective. Therefore, it is suggested to use sports viewing tickets as a means to effectively increase the number of blood donors during anticipated periods of blood shortage.
Episode for Data Collection
Here, I will conclude the analysis by sharing an episode from the data collection. The data used in this research was collected through various channels. For data related to blood services statistics, I was able to obtain well-organized information through the Statistics Korea API. However, other data sources were not as easily accessible, which was somewhat disappointing. While blood stock, usage, and supply data are available through other APIs, they only provide monthly data, which lacks the resolution needed for detailed analysis.
Fortunately, since the Korean Red Cross is a government organization, we were able to request daily data on blood stock, usage, and supply, as well as data on the giveaway promotion through a “Public Information Request”. Government departments or public institutions often provide access to such data, excluding sensitive personal information. I encourage other researchers to actively use information disclosure requests to obtain high-quality data. Especially, in South Korea, where the digitization of administrative data is well-developed, researchers can access the materials they need for their studies.
